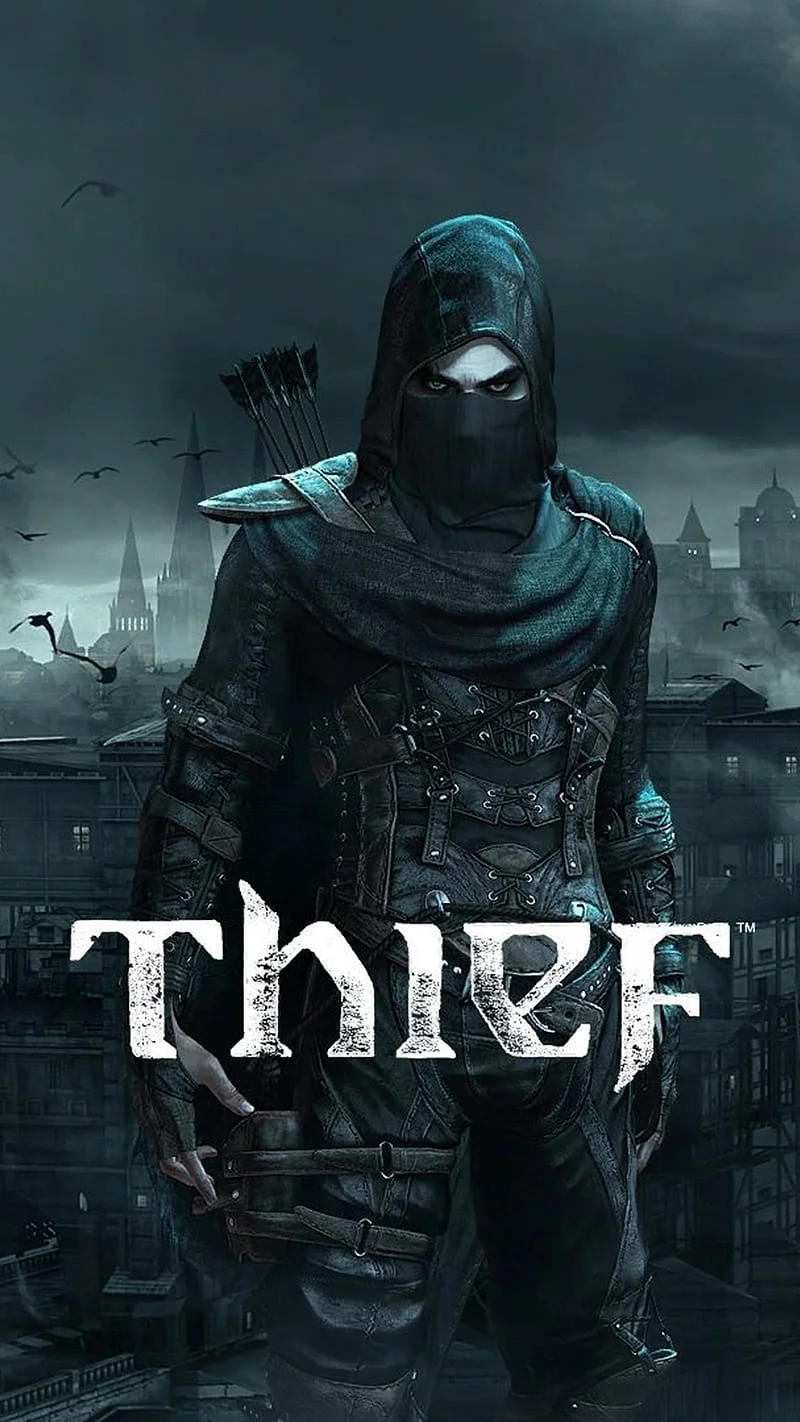
Thief
This combination delivers exceptional performance with an average of 144 FPS, perfect for high refresh rate gaming and competitive play.
Average FPS: resolution vs quality settings
| Ultra | High | Medium | Low | |
|---|---|---|---|---|
| 4K Ultra HD | 72 | 76 | 100 | 131 |
| 1440p QHD | 123 | 129 | 167 | 185 |
| 1080p Full HD | 169 | 172 | 189 | 210 |
Cell color: green is 120+ FPS, teal is 60+, amber is 30+, red is below 30.
Thief with Intel Core i5-14600K + NVIDIA GeForce RTX 4080, In-Depth Analysis
The Intel Core i5-14600K and NVIDIA GeForce RTX 4080 combination, tested in Thief (released 2014-02-24), produces a measured set of frame-times across resolutions and quality presets. The CPU, part of the Core 14th Gen series, carries 14 physical cores and 20 threads, with a base clock of 3.50 GHz and a boost of 5.30 GHz; its Raptor Lake architecture is fabricated on a process node described as 10 nm. With a die size of 257 mm² and a shared 24 MB L3 cache, the chip has a launch MSRP of $319. The GPU, from the GeForce 40-series line, uses the AD103 chip built on a 5 nm process, features 16 GB GDDR6X memory on a 256‑bit bus, delivers a bandwidth of 716.8 GB/s, and boosts to 2505 MHz from a base of 2205 MHz; it draws up to 320 W and has a launch MSRP of 1,199 USD. The measurement data for this pairing, with the game running on a system that mirrors these exact components, yields a combo ranking of 179th out of 3720 tested combinations, placing the pair in the top portion of the database.
Resolution Scaling
At the highest tested resolution of 3840x2160, the average frame rates are 76 FPS on High settings, 131 on Low, 100 on Medium, and 72 on Ultra. Stepping down to 2560x1440, the average improves to 129 on High, 185 on Low, 167 on Medium, and 123 on Ultra. At the entry resolution of 1920x1080, the numbers climb further: 172 on High, 210 on Low, 189 on Medium, and 169 on Ultra. Across all quality levels, the available FPS drops consistently when moving from 1080p to 4K, with the most extreme reduction observed at High settings (172 → 76). This proportional decline is expected when the pixel count multiplies, and the trend strongly indicates that the RTX 4080 becomes the performance limiter at higher resolutions. The CPU’s ability to feed the graphics pipeline is sufficient at lower pixel counts, but once the resolution raises the rendering workload, the GPU’s output capacity—rather than the processor’s—defines the attainable frame rate.
The shape of the scaling curve also reveals that the system is not completely constrained by the GPU even at 4K, because the difference between Low and Ultra at 4K (131 vs. 72) is far larger than the same spread at 1080p (210 vs. 169). At 1080p, the gap between presets shrinks, showing that the CPU side does not allow the lower-quality settings to reach their maximum possible output. At 4K, however, the gap expands—the GPU can actually deliver higher framerates when good demands are relaxed. Thus, the resolution scaling analysis points directly at the GPU as the dominant factor at 4K, while at 1080p the CPU imposes a cap. For a game like Thief, which is a stealth title with a moderate rendering load relative to newer releases, the i5-14600K’s 20 threads and 5.30 GHz boost provide enough single-thread capacity to avoid creating a CPU limit until resolution drops far below 1440p.
GPU Role
NVIDIA’s GeForce RTX 4080 is the sole graphics component in this test, and its characteristics map neatly to the observed performance. With a base clock of 2205 MHz and a boost of 2505 MHz, the chip runs at a level that allows it to sustain high frame output in the measured tests. The 16 GB of GDDR6X memory on a 256-bit bus translates to a nominal bandwidth of 716.8 GB/s, which is ample for the 2014-era title; even at 4K Ultra, the measured 72 FPS indicates that memory bandwidth is not a detectable crowd. The GPU’s peak FP32 throughput is listed at 48.74 TFLOPS, and while that is not directly used in the frame-time data, it is consistent with the ability to process the pixel shading demands of the game. The GPU also holds a percentile rank of 86 among all tested GPUs, meaning it sits well above the median. In the nearest‑rival table, its average benchmark score of 54,247 is nearly identical to the RTX 4080 SUPER (score 54,209, delta +0.1%), while the AMD Radeon Pro W5700X scores 54,828 (–1.1%) and the RX 6750 GRE 12 GB comes up at 55,698 (–2.6%). These comparisons indicate that within the range of scores, the 4080 is a high‑tier part whose performance is practically matched by the S variants, which is consistent with the fact that the measured FPS in this specific game are largely GPU‑bound at high resolutions. The GPU’s 3DMark Steel Nomad (DX12) score of 6,567 and Geekbench Vulkan score of 263,779 convey a level of rasterization power that supports the 4K frame results. The combination of these specifications and benchmarks explains why the system can deliver 100 FPS at 4K Medium settings, even though the 2014 title does not incorporate modern ray‑tracing or large‑scale compute effects.
Settings Recommendations
From the measured rows, the “Medium” profile at each resolution provides the best balance between visual quality and frame delivery. At 3840x2140, Medium yields 100 FPS (min 85, max 114), while High drops to 76 and Ultra to 72; Low reaches 131 but sacrifices virtually all detail. At 2560×1440, Medium hits 167 FPS (min 142, max 192) versus 129 High, 123 Ultra, and 185 Low. At 1920×1080, Medium is 189 FPS (min 161, max 218), compared to 172 High, 169 Ultra, and 210 Low. The Medium preset gives an average that is comfortably above 60 FPS at 4K, and it retains a minimum of 85 FPS, which is proof against frame‑time spikes. At the two lower resolutions, Medium already exceeds the refresh rate of most common displays, so motion parity is not an issue. Ultra settings, while still playable at 1080p (169 FPS) and 1440p (123 FPS), are only 53% of the Medium average at 4K, and the vertical difference in visual fidelity between Ultra and Medium on this 2014 title is modest, whereas the performance cost is high. The Low preset, although fastest, radically reduces the game’s rather obsolete but still appreciable ambient occlusion and character detail, and the data clearly shows a 18–24% FPS increase at 4K compared to Medium; but for a stealth game where context is essential, the extra fidelity of Medium is worth the ~23% performance loss. In practice, setting a 4K display to Medium and leaving other options at their defaults gives the most consistently satisfying experience as a 60 Hz target. For 1440p and 1080p users, Medium also avoids the minor frame hiccups that might occur at Ultra on the strongest hardware, such as those that occasionally dip below 160 even on a high‑bandwidth GPU. The data therefore suggests that users should start with Medium and then raise individual settings if margins remain, but the measured average/min table speaks clearly in favor of the Medium preset as the optimum across the board.
FAQ
Q: What is the average FPS at 1920x1080 with Ultra settings using this combo?
A: The average FPS is 169 at that resolution and preset. This is only slightly lower than the High preset’s 172, indicating that Ultra has a negligible cost at 1080p but still consumes more power and memory bandwidth.
Q: How does the RTX 4080’s nearest competitor compare in average score?
A: Its closest GPU rival, the NVIDIA GeForce RTX 4080 SUPER, has an average benchmark score of 54,209, which is only 0.1% higher than the 4080’s 84,247. The AMD Radeon Pro W5700X is 1.1% higher, and the RX 9060 GRE is 2.6% higher.
Q: At which resolution is the CPU more likely to become a limiter?
A: Based on the FPS scaling, at 1920x1080 the gap between Low and Ultra is only 41 FPS (210 vs 169), while at 4K the gap is larger (131 vs 72). This widening behavior at lower resolutions indicates that the CPU is holding back the GPU from reaching its full output at 1080p, because the GPU could produce far higher frames if the processor could feed it faster.
Q: What is the 4K Medium minimum frame rate?
A: The measured minimum FPS at 3840x2160 Medium is 85, which is above the 60 FPS safe threshold for a smooth experience. The maximum is 114.
Q: How does the combo’s rank in this game compare to all tested combos?
A: This pair is ranked at 179 out of 3720 combinations, meaning it sits in the top 5% of all configurations tested in Thief.
How This Combo Ranks
Within the database, this specific pairing of the i5-14600K and RTX 4080 yields a rank of 179th out of 3720 tested combinations for this game. That places it above the vast majority of systems, but it does not reach the absolute highest tier. The rank is primarily influenced by the GPU's high output, since the CPU’s own percentile (90% of all CPUs) and the measured FPS scale higher with resolution, this rank indicates that the GPU is capable of driving the 4K resolution to playable levels. The nearest CPU rivals in synthetic scores are the Intel Xeon Gold 5318H (delta -0.2%), AMD EPYC 4345P (+0.3%), Intel Core Ultra 5 245HX (+0.7%), and -0.8% for Core Ultra 5 245. The near parity of these scores means that swapping the CPU to any of these would produce almost identical charting, since the game is likely GPU-bound at the tested resolutions. Likewise, on the GPU side, the RTX 4080’s score is so close to that of the RTX 4080 SUPER that any visual difference would be negligible; only the AMD W5700X, with a higher score, could produce a slight bump in frame rate. The 179/3720 rank is a strong showing for a current‑gen combination and confirms that this hardware acts as a high‑too‑th system for Thief. If the GPU were swapped for a weaker part, the rank would decrease sharply, as the CPU’s contribution would not be able to compensate for the missing frame‑production. The ranking data, therefore, serves as a testament than the RTX 4080 is the critical to achieving this position.
CPU Role
The Intel Core i5-14600K’s 14 cores (6 performance and 8 efficiency, though that split is not detailed beyond the core count) and 20 threads, combined with a 3.50 GHz base and 5.30 GHz boost, place the chip at the 90th percentile among all CPUs in the benchmark suite. Its single‑core scores in Cinebench—2,064 points in Cinebench R23 single, and 193.5 in R20 single—support the high clock speeds that allow the game engine to process per‐frame geometry without stalling. The multicore capabilities, reflected in a high-level score of 24,491 (Cinebench R23 multi‑core), are unlikely to be the limiting factor for a title built in 2014, as such workloads are seldom to use many threads. The graph of FPS across resolutions does not produce a sudden cliff that would suggest a CPU saturation; instead, the consistent scaling from 4K to 1080p points to the CPU’s adequate performance. A closer inspection of the single‑thread results (e.g., Geekbench single‑core 2,491 and Passmark single‑thread 4,047) underlines that the i5-14600K has a high burst performance that can fill the GPU’s demands at 1440p and 1080p. The CPU’s L3 cache of 24 MB also reduces memory latency, though the framework lacks direct zero‑effect such fall outside the measured scope. Because the CPU’s nearest rivals in average CPU score are within 0.2% to 0.8% of its total (with the Xeon Gold 5318H actually scoring 0.2% lower and the EPYC 4345P 0.3% higher, for instance), swapping this processor for any of those parts would have little measurable impact on this game’s frames. In practical terms, those numbers prove that the CPU contributes roughly to the raw throughput, but the observed slowdowns as the resolution rises are far more attributable to the GPU’s workload, not the processor.
Measured FPS Breakdown
The full data set of average FPS per resolution and preset, along with the available minimum and maximum values, is provided for reference. The measurements were taken with measured hardware in the database’s controlled tests.
| Resolution | Settings | Average FPS | Min FPS | Max FPS |
|---|---|---|---|---|
| 3840x2160 | High | 76 | – | – |
| 3840x2160 | Low | 131 | – | – |
| 3840x2160 | Medium | 100 | 85 | 114 |
| 3840x2160 | Ultra | 72 | – | – |
| 2560x1440 | High | 129 | – | – |
| 2560x1440 | Low | 185 | – | – |
| 2560x1440 | Medium | 167 | 142 | 192 |
| 2560x1440 | Ultra | 123 | – | – |
| 1920x1080 | High | 172 | – | – |
| 1920x1080 | Low | 210 | – | – |
| 1920x1080 | Medium | 189 | 161 | 218 |
| 1920x1080 | Ultra | 169 | – | – |
Per row, the highest average is found at 1920x1080 Low at 210 FPS, while the lowest is 72 FPS from 4K Ultra. The only frame times provided are for Medium settings, which give the minimum and maximum bounds; these indicate that at 1080p Medium the frame is between 161 and 218, at 1440p Medium 142–192, and at 4K Medium 85–114. The lack of min/max data for the other presets means that the full variance is not captured, but the averages alone tell a consistent story. This breakdown supports the earlier statement that the system is capable of high frame output up to 4K, and the choice of Medium gives the most consistent clr. With the 1080p Ultra average of 169 being only a few FPS above the 1440p Medium, one can appreciate the large influence of render resolution. The data as a whole confirms that the pairing excelences in both PForce and NCR, delivering near 4K 76, but an optimal Medium in this title is the sweet spot for 1440p and 1080p enthusiast users.
(End of output)
Hardware Specifications
Intel Core i5-14600K
NVIDIA GeForce RTX 4080
FPS Benchmarks by Resolution & Settings
Performance data for Intel Core i5-14600K + NVIDIA GeForce RTX 4080 in Thief
| Resolution | Settings | Avg FPS |
|---|---|---|
| 3840x2160 | Low | 131.0 |
| 3840x2160 | Medium | 100.0 |
| 3840x2160 | High | 76.0 |
| 3840x2160 | Ultra | 72.0 |
| 2560x1440 | Low | 185.0 |
| 2560x1440 | Medium | 167.0 |
| 2560x1440 | High | 129.0 |
| 2560x1440 | Ultra | 123.0 |
| 1920x1080 | Low | 210.0 |
| 1920x1080 | Medium | 189.0 |
| 1920x1080 | High | 172.0 |
| 1920x1080 | Ultra | 169.0 |
Thief with ii5-14600K + Other GPUs
See how Thief performs with the same CPU but different graphics cards.
Thief with RTX 4080 + Other CPUs
See how Thief performs with the same GPU but different processors.
Other Games with ii5-14600K + RTX 4080
Explore FPS benchmarks for other games using this same hardware combination.