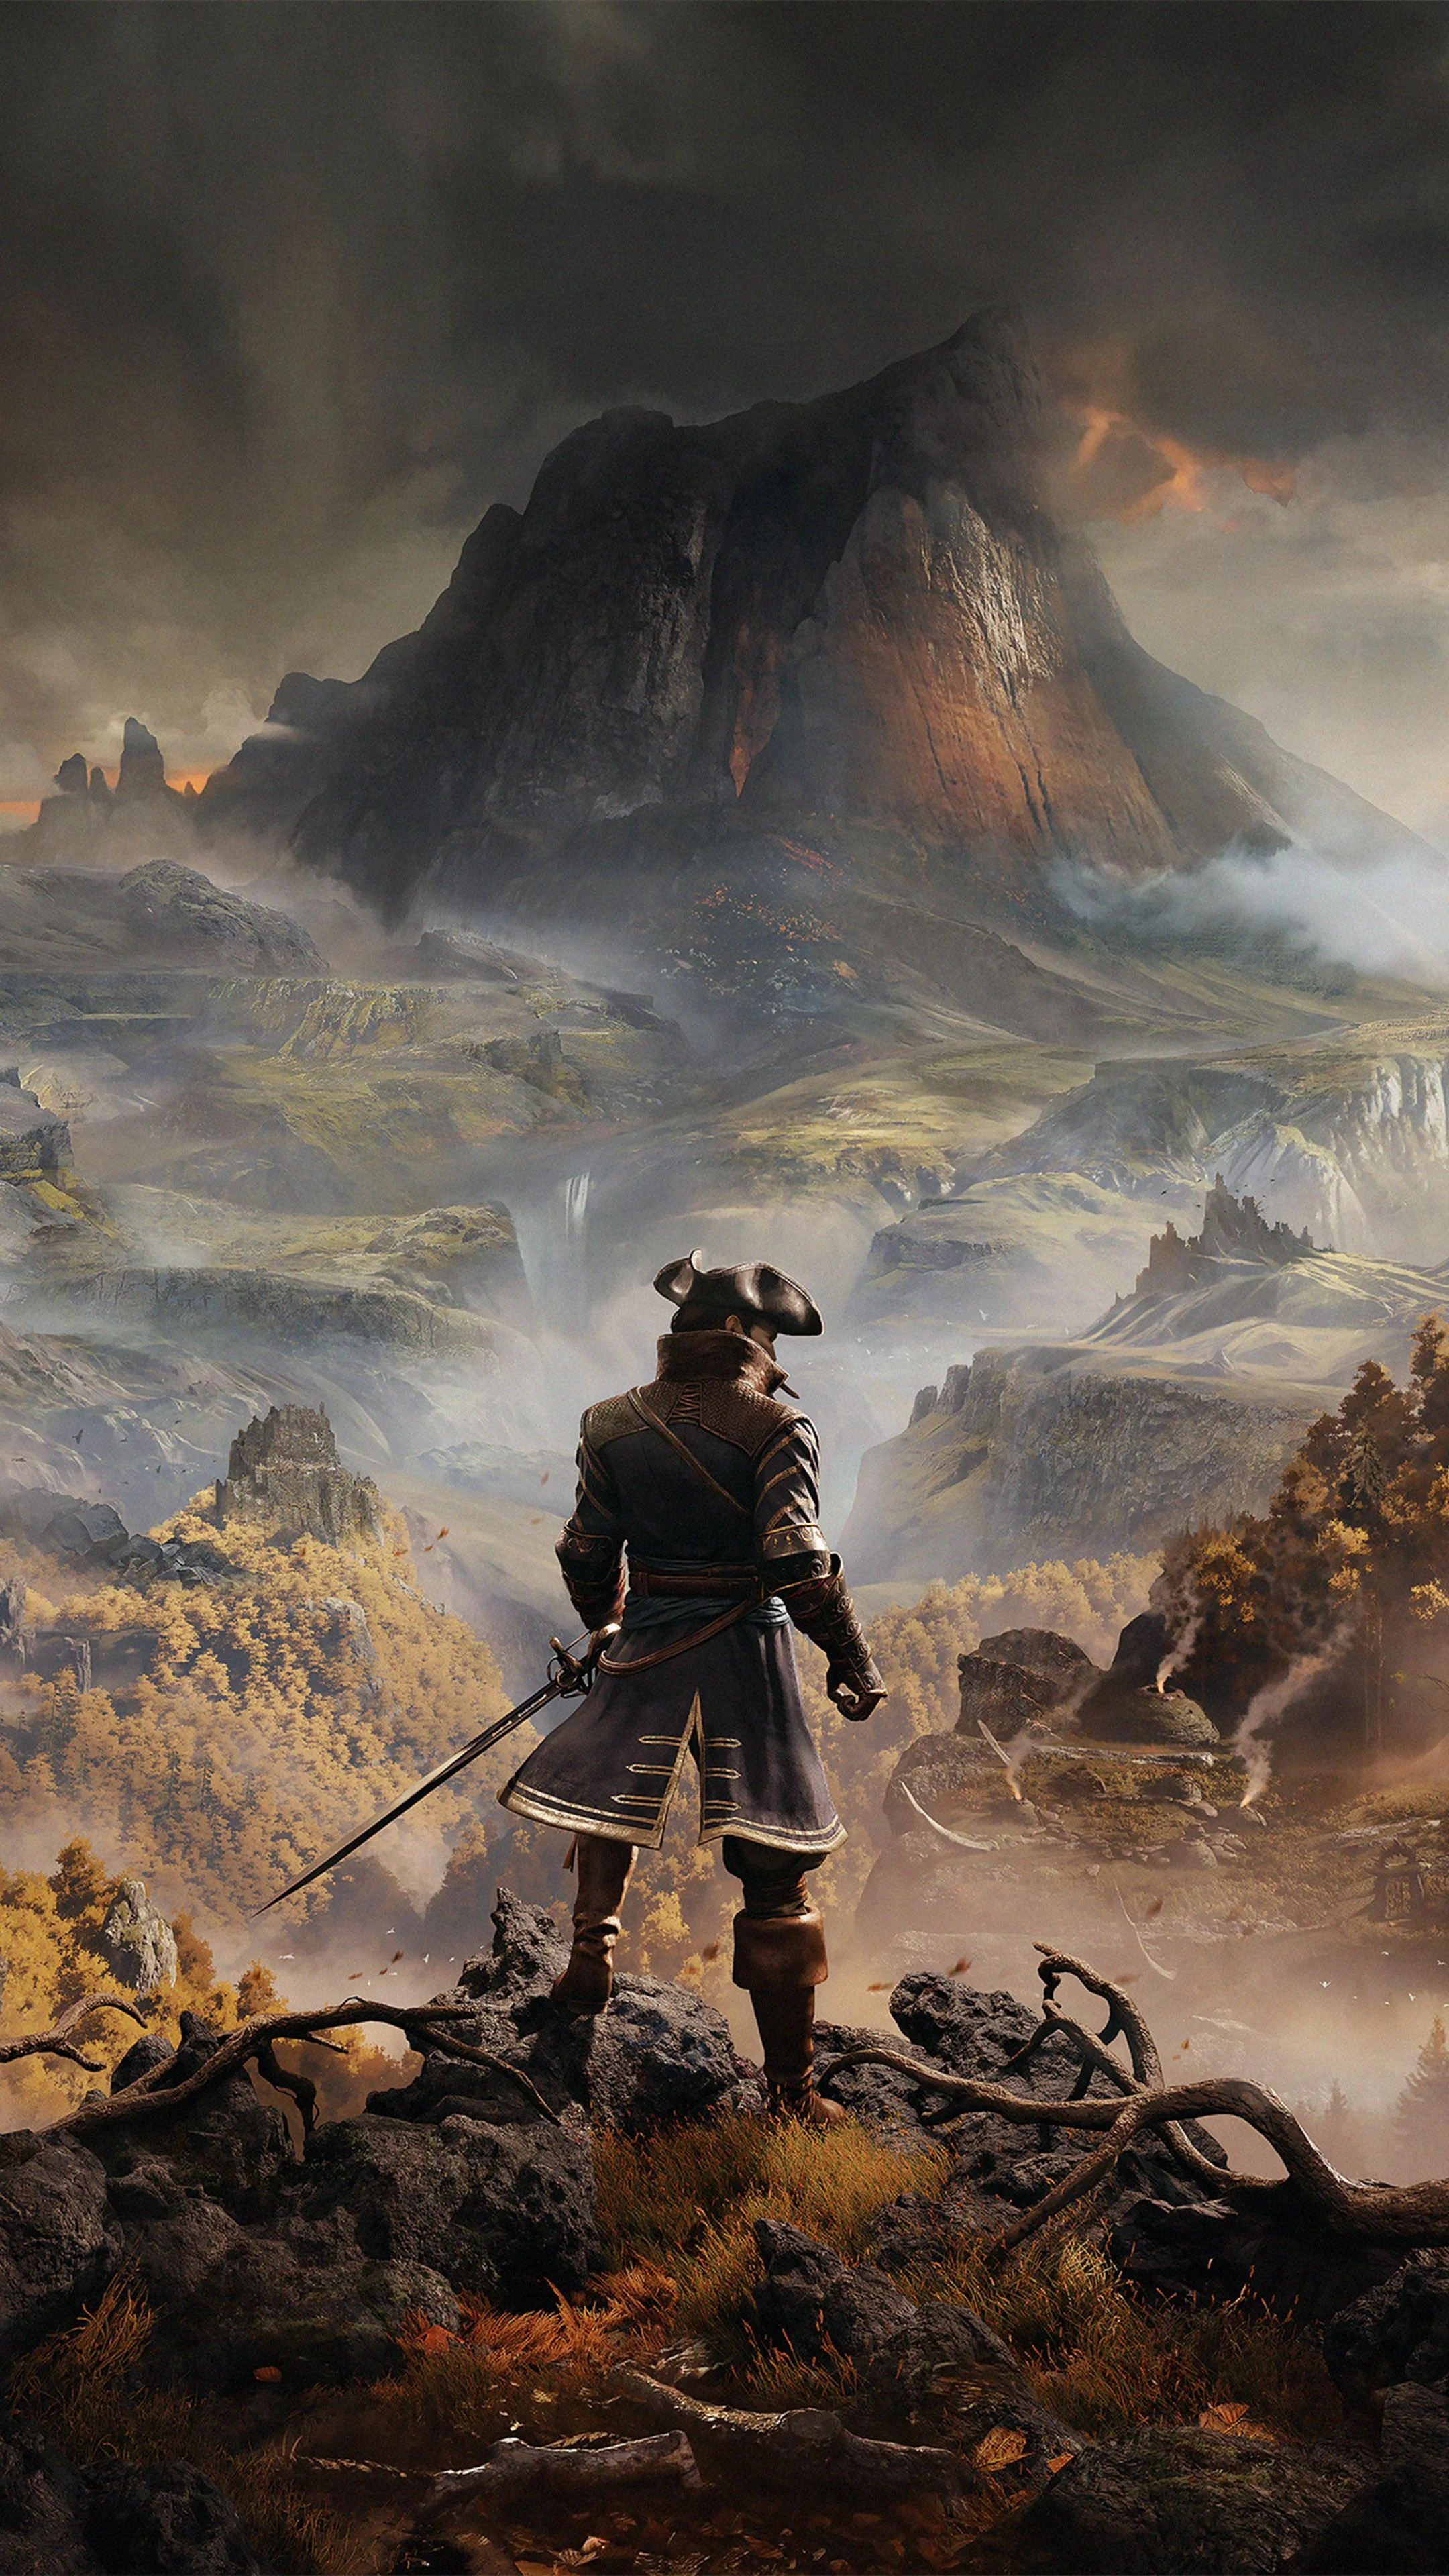
Greedfall
This combination provides smooth gameplay with an average of 112 FPS, suitable for most gaming scenarios.
Average FPS: resolution vs quality settings
| Ultra | High | Medium | Low | |
|---|---|---|---|---|
| 4K Ultra HD | 40 | 61 | 73 | 91 |
| 1440p QHD | 68 | 110 | 114 | 148 |
| 1080p Full HD | 96 | 152 | 170 | 215 |
Cell color: green is 120+ FPS, teal is 60+, amber is 30+, red is below 30.
Greedfall with AMD Ryzen 7 5700G + NVIDIA GeForce RTX 3070 Ti, In-Depth Analysis
Greedfall, an Action RPG released on 2019-09-09, is paired here with the AMD Ryzen 7 5700G and the NVIDIA GeForce RTX 3070 Ti. The dataset is marked as measured and contains average FPS for Low, Medium, High, and Ultra presets at 1920x1080, 2560x1440, and 3840x2160. The combination has a rank of 685 out of 1705 tested configurations, with the CPU in the 83rd percentile and the GPU in the 74th percentile.
Resolution Scaling
At 1920x1080, Low averages 214.9 FPS, Medium 169.5 FPS, High 152.2 FPS, and Ultra 95.6 FPS. At 2560x1440, the same order yields 148.3, 114.4, 110, and 68. At 3840x2160, the results are 91.3, 73.1, 61, and 40.3. Every preset follows the same direction: higher resolution means lower average FPS, and the Low-through-Ultra order remains intact at each resolution. This consistency points to a workload that responds predictably to pixel count and preset quality.
The drop from 1920x1080 to 3840x2160 is particularly visible on the High preset, which goes from 152.2 to 110 at 2560x1440 and then to 61 at 3840x2160. The 61 average at 3840x2160 High is close to the 68 at 2560x1440 Ultra, suggesting the resolution step matters as much as the preset step in this game. At 1920x1080 Low, the 214.9 result is high enough that the CPU, not the GPU, is likely the active constraint. Once the resolution climbs to 3840x2160, the GPU becomes the limiting component: even Low drops to 91.3, and Ultra falls to 40.3.
CPU Role
The AMD Ryzen 7 5700G is a desktop processor built on Zen 3 (Cezanne) at 7 nm. It has 8 cores and 16 threads, with a base clock of 3.80 GHz and a boost clock of 4.60 GHz. The 65 W TDP and dual-channel DDR4 support make it a conventional AM4 part. Cache is 64 KB L1 per core, 512 KB L2 per core, and 16 MB L3. The CPU-side memory bandwidth is 51.2 GB/s.
CPU benchmark results put the 5700G near the top of its immediate class. Its average benchmark score is 25626, with an 83rd percentile rank. The closest rivals by average score are the AMD Ryzen 7 6800U at 25706 (deltaPct -0.3), the Intel Xeon D-2752TER at 25532 (deltaPct 0.4), the Intel Core 5 210H at 25490 (deltaPct 0.5), and the AMD Ryzen 5 7640U at 25485 (deltaPct 0.6). The spread between those scores is narrow, so the 5700G is not an outlier in either direction.
Single-thread performance is strong enough for this game. The 3DMark single-thread score is 899, and the 2-thread score is 1758. Cinebench R23 single-core is 2930, and Geekbench single-core is 2016. On the multithread side, Cinebench R23 multi-core reaches 20755, and Geekbench multi-core reaches 8970. The 3DMark 16-thread score of 6629 and max-thread score of 6627 are effectively identical, which is expected for a 16-thread CPU with no additional logical cores beyond its 16 threads.
At 1920x1080 Low, the measured FPS is 214.9. That result relies on the CPU’s ability to feed the GPU, and the single-thread and 2-thread scores indicate the 5700G can handle a 2019 Action RPG without holding back low-resolution framerates. At higher resolutions, the CPU headroom is less relevant because the GPU frame time dominates.
GPU Role
The NVIDIA GeForce RTX 3070 Ti uses the GA104 chip on Samsung’s 8 nm process. It has 8 GB of GDDR6X on a 256-bit bus, with memory clock 1188 MHz and 19 Gbps effective signalling. Memory bandwidth is 608.3 GB/s. The GPU runs at a base clock of 1575 MHz and a boost clock of 1770 MHz. Its 6144 shading units, 192 TMUs, and 96 ROPs are backed by 48 RT cores and 192 tensor cores. FP32 throughput is 21.75 TFLOPS.
The RTX 3070 Ti’s average benchmark score is 30849, placing it at the 74th percentile. Its nearest rivals are the AMD Radeon RX 590 GME (30755, deltaPct 0.3), AMD Radeon RX 6700 (31112, deltaPct -0.8), NVIDIA Quadro M5000 (31142, deltaPct -0.9), and NVIDIA GRID M60-1Q (31220, deltaPct -1.2). The GPU occupies a comfortable mid-to-upper position in the benchmark distribution.
At 3840x2160, the measured average FPS drops to 91.3 on Low, 73.1 on Medium, 61 on High, and 40.3 on Ultra. The 8 GB VRAM is the memory amount on the card, and the pattern across presets points to raw rendering throughput as the main factor: lowering the preset from Ultra to Medium at 3840x2160 raises the average from 40.3 to 73.1. At 2560x1440, Ultra averages 68, while High averages 110 and Medium 114.4. At 1920x1080, Ultra averages 95.6, while High averages 152.2. The GPU’s influence is visible in the consistent penalty that Ultra imposes across all resolutions.
The card is a Dual-slot design with a 290 W TDP and a suggested 600 W PSU. It uses a 12-pin power connector. These are relevant constraints when building around this combo, but the measured FPS data shows the card can deliver 214.9 at 1920x1080 Low and 40.3 at 3840x2160 Ultra.
FAQ
Q: What is the highest average FPS in the measured data?
A: The highest is 214.9 FPS at 1920x1080 Low. The next highest preset at that resolution is Medium at 169.5, then High at 152.2, and Ultra at 95.6.
Q: How does the CPU rank compared with its nearest rivals?
A: The Ryzen 7 5700G has an average benchmark score of 25626 and sits at the 83rd percentile. The AMD Ryzen 7 6800U scores 25706 with a deltaPct of -0.3, the Intel Xeon D-2752TER scores 25532 with 0.4, the Intel Core 5 210H scores 25490 with 0.5, and the AMD Ryzen 5 7640U scores 25485 with 0.6.
Q: What is the 3840x2160 Ultra result, and how does it compare to the other presets?
A: At 3840x2160, Ultra averages 40.3 FPS, while Low averages 91.3, Medium 73.1, and High 61. The Ultra preset is the slowest measured row in the entire dataset.
Q: Does the dataset include memory utilization information?
A: No. The RTX 3070 Ti has 8 GB of GDDR6X memory, but the measured dataset only reports average FPS per preset and resolution. It does not include VRAM usage numbers.
Q: What are the GPU’s nearest rival scores?
A: The RTX 3070 Ti averages 30849. The nearest listed rivals are the AMD Radeon RX 590 GME (30755, deltaPct 0.3), AMD Radeon RX 6700 (31112, deltaPct -0.8), NVIDIA Quadro M5000 (31142, deltaPct -0.9), and NVIDIA GRID M60-1Q (31220, deltaPct -1.2).
Q: What rank does this combo hold in Greedfall’s tested configurations?
A: The rank is 685 out of 1705 combinations, with the CPU at the 83rd percentile and the GPU at the 74th percentile.
Settings Recommendations
Measured data gives clear guidance. At 1920x1080, High is the most sensible preset: it averages 152.2 FPS, while Medium averages 169.5 and Ultra 95.6. The jump from High to Ultra costs more measured performance than the jump from Medium to High, so High is the best balance of quality and FPS in the dataset.
At 2560x1440, Medium and High are close: 114.4 and 110. If the priority is visual fidelity, High adds quality at a small FPS cost. If the priority is keeping the average as high as possible, Medium is the stronger choice. Low at 148.3 is available for maximum FPS, while Ultra at 68 is the weakest measured option at this resolution.
At 3840x2160, Low averages 91.3, Medium 73.1, High 61, and Ultra 40.3. Medium is the highest preset that retains a clear margin over the 40.3 Ultra result while also offering better visuals than Low. For users who want stronger visuals, High at 61 FPS is still well above the Ultra result.
Across all resolutions, Ultra is difficult to justify from the measured rows. At 1920x1080 it drops to 95.6, at 2560x1440 to 68, and at 3840x2160 to 40.3. High or Medium keeps the average FPS higher at every resolution. For this configuration, the data supports High at 1920x1080 and 2560x1440, and Medium at 3840x2160 as the best measured experience.
Measured FPS Breakdown
All values below are average FPS as reported in the measured dataset. The dataset contains no min or max FPS values for these rows.
| Resolution | Low | Medium | High | Ultra |
| --- | ---: | ---: | ---: | ---: |
| 1920x1080 | 214.9 | 169.5 | 152.2 | 95.6 |
| 2560x1440 | 148.3 | 114.4 | 110 | 68 |
| 3840x2160 | 91.3 | 73.1 | 61 | 40.3 |
Hardware Specifications
AMD Ryzen 7 5700G
NVIDIA GeForce RTX 3070 Ti
FPS Benchmarks by Resolution & Settings
Performance data for AMD Ryzen 7 5700G + NVIDIA GeForce RTX 3070 Ti in Greedfall
| Resolution | Settings | Avg FPS |
|---|---|---|
| 3840x2160 | Low | 91.3 |
| 3840x2160 | Medium | 73.1 |
| 3840x2160 | High | 61.0 |
| 3840x2160 | Ultra | 40.3 |
| 2560x1440 | Low | 148.3 |
| 2560x1440 | Medium | 114.4 |
| 2560x1440 | High | 110.0 |
| 2560x1440 | Ultra | 68.0 |
| 1920x1080 | Low | 214.9 |
| 1920x1080 | Medium | 169.5 |
| 1920x1080 | High | 152.2 |
| 1920x1080 | Ultra | 95.6 |
Greedfall with Ryzen 7 5700G + Other GPUs
See how Greedfall performs with the same CPU but different graphics cards.
Greedfall with RTX 3070 Ti + Other CPUs
See how Greedfall performs with the same GPU but different processors.
Other Games with Ryzen 7 5700G + RTX 3070 Ti
Explore FPS benchmarks for other games using this same hardware combination.