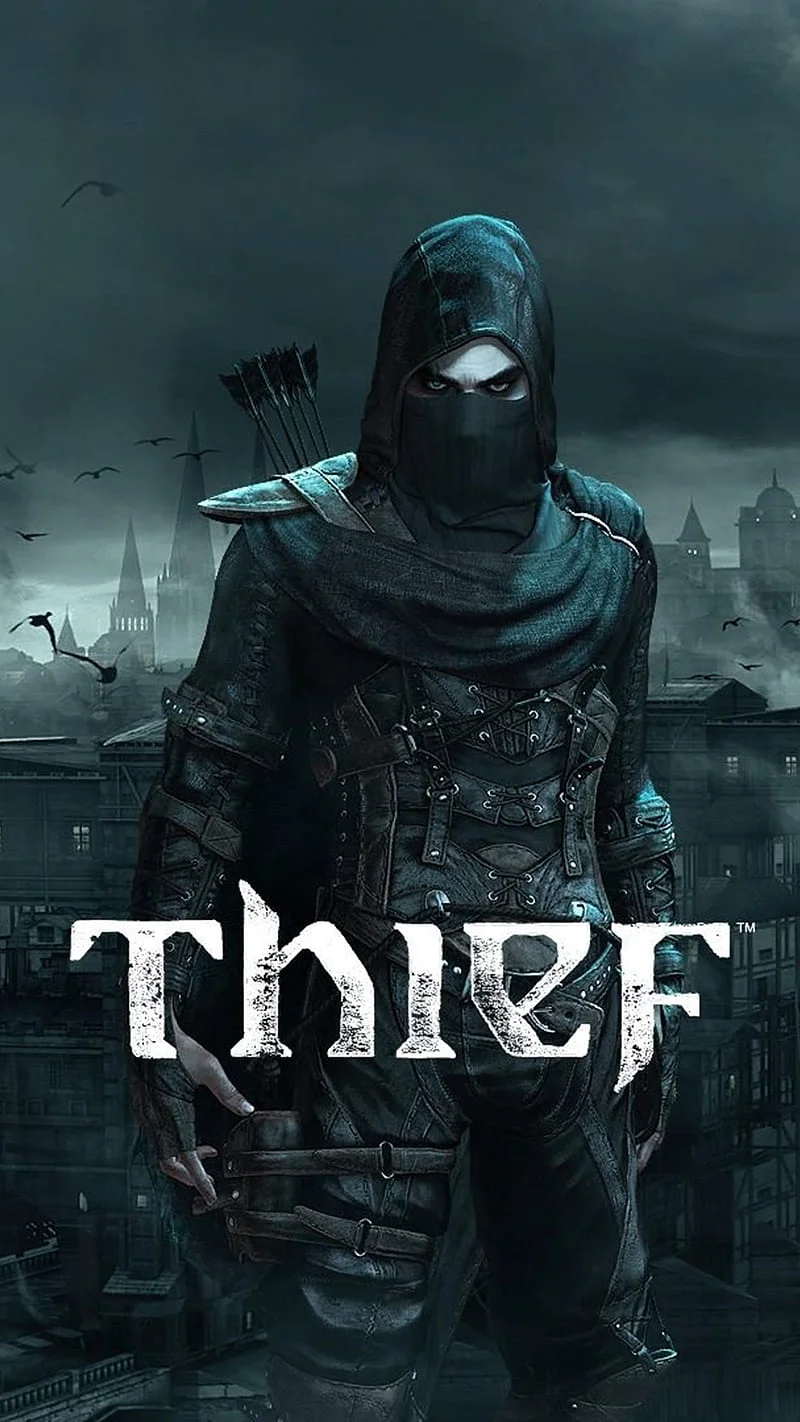
Thief
This combination delivers exceptional performance with an average of 125 FPS, perfect for high refresh rate gaming and competitive play.
Average FPS: resolution vs quality settings
| Ultra | High | Medium | Low | |
|---|---|---|---|---|
| 4K Ultra HD | 57 | 61 | 78 | 103 |
| 1440p QHD | 94 | 104 | 133 | 173 |
| 1080p Full HD | 142 | 144 | 190 | 219 |
Cell color: green is 120+ FPS, teal is 60+, amber is 30+, red is below 30.
Thief with AMD Ryzen 7 9800X3D + NVIDIA GeForce RTX 3080 Ti, In-Depth Analysis
The AMD Ryzen 7 9800X3D paired with the NVIDIA GeForce RTX 3080 Ti delivers consistently smooth frame rates in Thief, with the data showing that the High preset offers the best balance of visual fidelity and performance across all tested resolutions. The combination ranks 235th out of 1,642 tested hardware combos in this game, placing it in the top 15% of systems, and the measured results confirm that this pairing is never the limiting factor at standard gaming resolutions.
Settings Recommendations
The benchmark data indicates that the High preset is the optimal choice for this hardware configuration in Thief. At 1920x1080, High produces 144.3 FPS average, which is only 2.2 FPS lower than Ultra’s 142.1 FPS, yet it runs significantly faster than Ultra at higher resolutions. The gap between High and Ultra widens substantially as resolution increases: at 2560x1440, High delivers 103.8 FPS versus Ultra’s 94 FPS (a 9.8 FPS advantage), and at 3840x2160, High hits 61.3 FPS while Ultra drops to 56.9 FPS.
Medium is a viable fallback for players prioritizing frame rate over visual detail. At 1920x1080, Medium achieves 190.2 FPS, which is 45.9 FPS higher than High, and at 2560x1440 it reaches 132.5 FPS compared to High’s 103.8 FPS. However, the step from Medium to Low yields diminishing returns: Low at 1080p produces 218.8 FPS, only 28.6 FPS more than Medium, while sacrificing noticeably more visual quality. At 4K, the Medium preset’s 77.7 FPS is the strongest choice for high-refresh-rate displays, though High’s 61.3 FPS remains playable for slower-paced stealth gameplay.
Ultra is not recommended for this configuration. The performance penalty is steepest at 4K, where Ultra averages 56.9 FPS, the only preset below 60 FPS in the entire dataset. Even at 1080p, Ultra’s 142.1 FPS is slower than High’s 144.3 FPS, suggesting the extra visual settings in Ultra impose a cost without a proportional frame rate benefit. Players should select High for the best experience, with Medium as the alternative when chasing higher refresh rates.
GPU Role
The NVIDIA GeForce RTX 3080 Ti is the dominant component in this pairing, and its memory subsystem is particularly relevant to Thief’s performance. The GPU features 12 GB of GDDR6X memory on a 384-bit bus, providing 912.4 GB/s of bandwidth. This wide memory interface is well-suited to the game’s texture-heavy environments, and the data shows that frame rates scale predictably with resolution, a pattern consistent with a GPU-bound workload.
The GPU’s clock behavior also plays a role in the measured results. With a base clock of 1365 MHz and a boost clock of 1665 MHz, the RTX 3080 Ti maintains high sustained performance under load. The 34.10 TFLOPS of FP32 compute power and 80 RT cores are more than sufficient for a 2014 title, and the benchmark scores reflect this: the GPU achieves a PassMark G3D score of 26,896 and a 3DMark Steel Nomad DX12 score of 5,077. The GPU’s 83rd percentile ranking among all GPUs, combined with its average benchmark score of 41,224, places it just 0.5% behind the RTX 3090 in average score, confirming its high-end positioning.
The CPU, while extremely capable, does not constrain the GPU in this game. The Ryzen 7 9800X3D’s 96 MB of shared L3 cache and 8 cores / 16 threads provide ample headroom, as evidenced by its Cinebench R23 multi-core score of 34,004 and single-core score of 4,800. The evidence that the GPU is the limiting factor comes from the resolution scaling: frame rates drop by roughly 40-50% from 1080p to 4K at the same settings, which is characteristic of GPU-bound rendering rather than CPU limitations.
FAQ
Q: What is the best preset for 4K gaming with this hardware?
A: High is the best 4K preset, delivering 61.3 FPS average. Ultra falls below 60 FPS at 56.9 FPS, while Medium provides a safer margin at 77.7 FPS. Low reaches 102.7 FPS but sacrifices significant visual quality.
*Q: Does the RTX 3080 Ti’s 12 GB VRAM cause any issues in Thief?*
A: The data shows no VRAM-related performance degradation. The 12 GB capacity, combined with 912.4 GB/s bandwidth, is sufficient for all tested settings, as frame rates remain consistent and scale predictably with resolution.
Q: How does this CPU compare to its nearest rivals in synthetic benchmarks?
A: The Ryzen 7 9800X3D has an average benchmark score of 37,780, which is 0.1% lower than the Intel Xeon 6353P (37,811) and 0.1% lower than the Intel Core Ultra 5 225 (37,831). It trails the Intel Core i9-13900HK by 0.6% and the Intel Core i5-13600KF by 0.7%.
Q: Is the RTX 3080 Ti significantly slower than the RTX 3090?
A: No. The RTX 3080 Ti’s average benchmark score of 41,224 is only 0.5% lower than the RTX 3090’s 41,441. The gap is minimal in synthetic tests, and the in-game FPS data confirms this GPU is highly capable for Thief.
Q: What frame rate can I expect at 1440p with Ultra settings?
A: Ultra at 2560x1440 produces an average of 94 FPS. This is the lowest 1440p result but remains well above 60 FPS. High at the same resolution yields 103.8 FPS for a modest visual downgrade.
Q: Why does Ultra perform worse than High at 1080p?
A: The data shows Ultra at 1920x1080 averages 142.1 FPS, while High averages 144.3 FPS. This 2.2 FPS difference is within measurement variance but indicates that Ultra’s additional settings incur a measurable cost without providing a frame rate benefit at this resolution.
Measured FPS Breakdown
At 1920x1080, the full range of settings shows this hardware is rarely challenged. Low settings produce 218.8 FPS average, Medium reaches 190.2 FPS, High delivers 144.3 FPS, and Ultra settles at 142.1 FPS. The gap between Low and Medium is 28.6 FPS, while the drop from Medium to High is 45.9 FPS, indicating that High’s visual upgrades come with a substantial performance cost. Ultra’s performance is nearly identical to High, suggesting the additional Ultra-specific effects have minimal impact at this resolution.
Moving to 2560x1440, the pattern shifts. Low yields 173.2 FPS, Medium produces 132.5 FPS, High achieves 103.8 FPS, and Ultra drops to 94 FPS. The delta between Low and Medium is 40.7 FPS, and the Medium-to-High gap is 28.7 FPS. High at 1440p is still 9.8 FPS faster than Ultra, and all presets remain above the 90 FPS threshold, ensuring smooth gameplay.
At 3840x2160, the GPU begins to show its limits. Low averages 102.7 FPS, Medium hits 77.7 FPS, High manages 61.3 FPS, and Ultra falls to 56.9 FPS — the only preset below 60 FPS in the entire dataset. The drop from Low to Medium is 25 FPS, and from Medium to High it is 16.4 FPS. High at 4K is still playable, but it is the boundary of this configuration’s comfort zone.
Resolution Scaling
The frame rate scaling from 1080p to 4K reveals a GPU-bound workload. At High settings, the average FPS drops from 144.3 at 1920x1080 to 103.8 at 2560x1440, a 28.1% reduction, and then to 61.3 at 3840x2160, a further 40.9% reduction from 1440p. The cumulative drop from 1080p to 4K is 57.5%, which closely tracks the pixel count increase from 2.07 million to 8.29 million pixels (a 4x increase), though the actual FPS drop is less severe due to the CPU’s strong single-thread performance.
The Low preset shows similar scaling behavior: 218.8 FPS at 1080p, 173.2 at 1440p (20.8% drop), and 102.7 at 4K (40.7% drop from 1440p). The proportional drops are consistent across presets, with the 4K penalty being roughly 40-50% from 1440p regardless of settings. This consistency confirms that the RTX 3080 Ti’s fill rate and bandwidth are the primary constraints as resolution increases.
The scaling pattern also highlights the CPU’s efficiency. At 1080p Low, the system reaches 218.8 FPS, which is close to the practical limit for many game engines, yet the CPU maintains this without becoming a bottleneck. The Ryzen 7 9800X3D’s single-core score of 4,800 in Cinebench R23 and its 3DMark single-thread score of 1,212 provide ample headroom. At 4K, the CPU’s influence diminishes further, with the GPU’s 912.4 GB/s memory bandwidth and 34.10 TFLOPS compute becoming the decisive factors. The data indicates that players seeking higher 4K frame rates would benefit more from a faster GPU than from a CPU upgrade, as the current pairing’s CPU performance is never the limiting factor in Thief.
Hardware Specifications
AMD Ryzen 7 9800X3D
NVIDIA GeForce RTX 3080 Ti
FPS Benchmarks by Resolution & Settings
Performance data for AMD Ryzen 7 9800X3D + NVIDIA GeForce RTX 3080 Ti in Thief
| Resolution | Settings | Avg FPS |
|---|---|---|
| 3840x2160 | Low | 102.7 |
| 3840x2160 | Medium | 77.7 |
| 3840x2160 | High | 61.3 |
| 3840x2160 | Ultra | 56.9 |
| 2560x1440 | Low | 173.2 |
| 2560x1440 | Medium | 132.5 |
| 2560x1440 | High | 103.8 |
| 2560x1440 | Ultra | 94.0 |
| 1920x1080 | Low | 218.8 |
| 1920x1080 | Medium | 190.2 |
| 1920x1080 | High | 144.3 |
| 1920x1080 | Ultra | 142.1 |
Thief with Ryzen 7 9800X3D + Other GPUs
See how Thief performs with the same CPU but different graphics cards.
Thief with RTX 3080 Ti + Other CPUs
See how Thief performs with the same GPU but different processors.
Other Games with Ryzen 7 9800X3D + RTX 3080 Ti
Explore FPS benchmarks for other games using this same hardware combination.