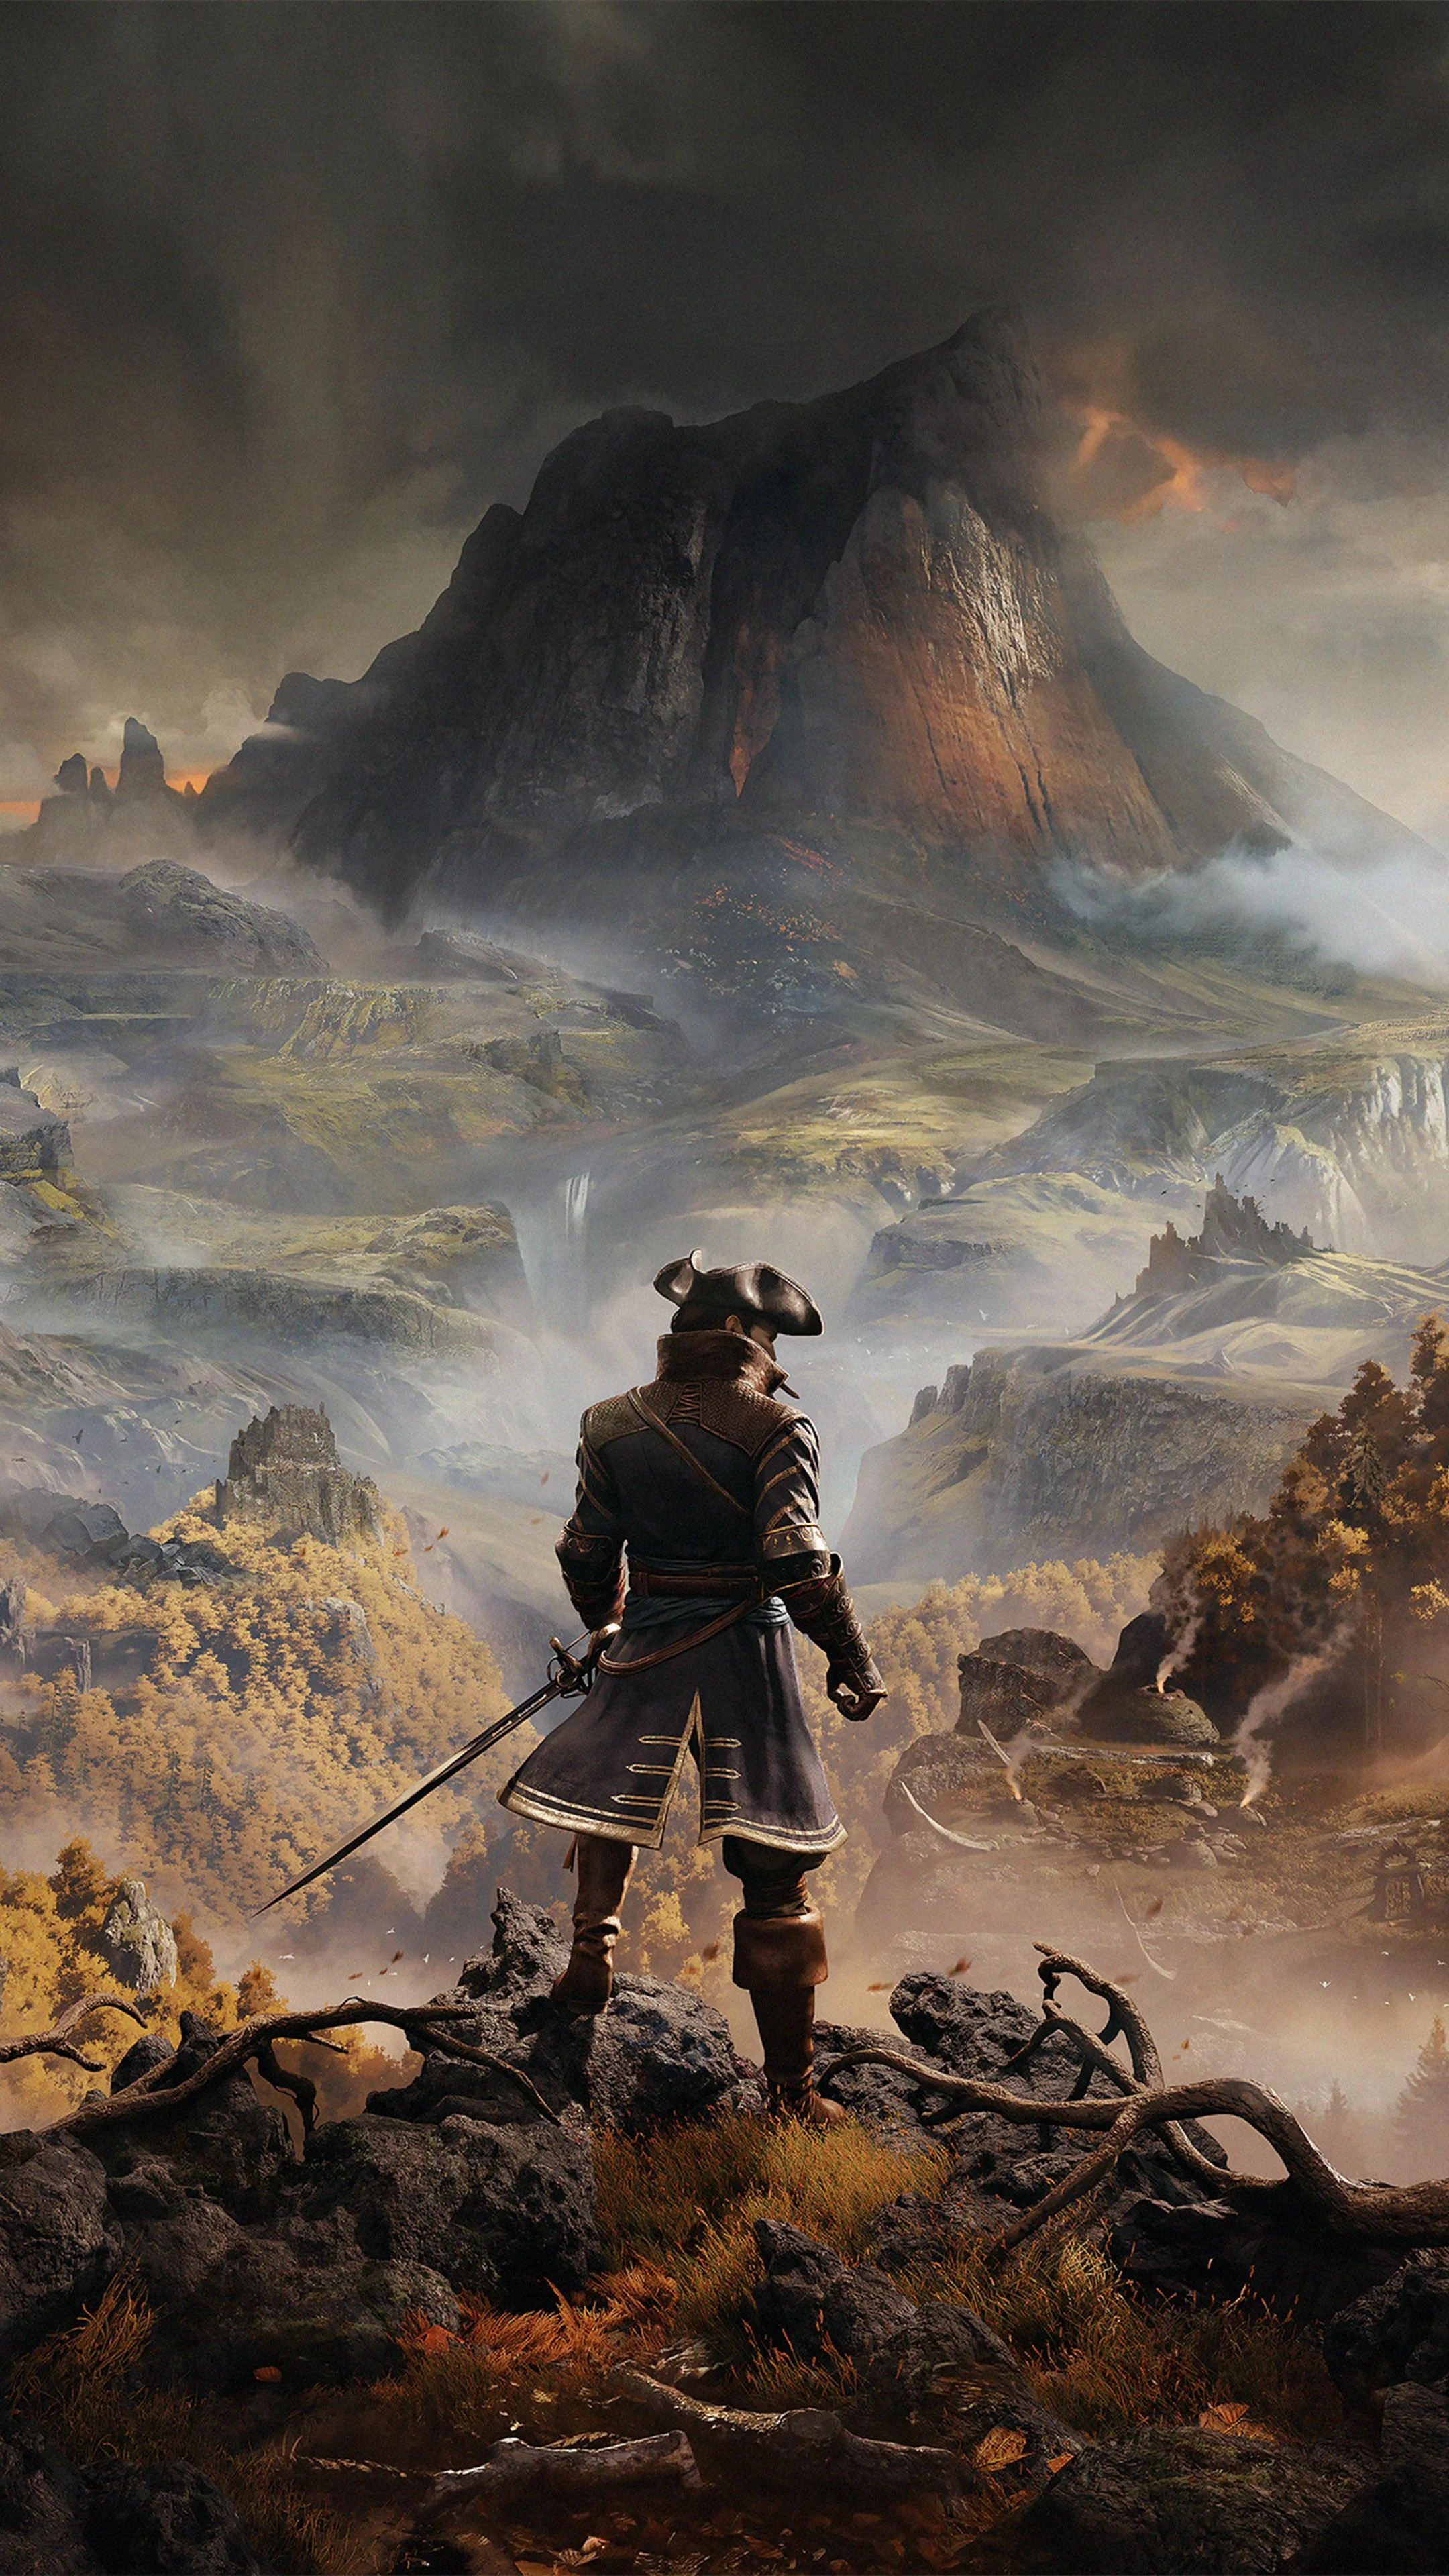
Greedfall
This combination delivers exceptional performance with an average of 153 FPS, perfect for high refresh rate gaming and competitive play.
Average FPS: resolution vs quality settings
| Ultra | High | Medium | Low | |
|---|---|---|---|---|
| 4K Ultra HD | 55 | 89 | 97 | 121 |
| 1440p QHD | 95 | 145 | 158 | 205 |
| 1080p Full HD | 137 | 211 | 230 | 295 |
Cell color: green is 120+ FPS, teal is 60+, amber is 30+, red is below 30.
Greedfall with AMD Ryzen 5 5600 + NVIDIA GeForce RTX 4070 Ti SUPER, In-Depth Analysis
Greedfall, an Action RPG from 2019, presents an interesting scaling profile when paired with the AMD Ryzen 5 5600 and NVIDIA GeForce RTX 4070 Ti SUPER. The measured data across three resolutions and four settings presets reveals a system that is heavily influenced by graphics load, with the CPU proving more than capable of feeding the GPU at lower resolutions.
Resolution Scaling
The transition from 1080p to 4K demonstrates a classic GPU-bound scaling curve, though the magnitude of the drop varies significantly depending on the quality preset. At Low settings, the average frame rate falls from 295.1 FPS at 1920x1080 to 121.4 FPS at 3840x2160, a reduction of approximately 59%. This steep decline indicates that even at the lowest settings, the pixel throughput demand at 4K is substantial enough to overwhelm the GPU's raw compute capacity.
Moving to Medium settings, the drop is less severe proportionally: 230.2 FPS at 1080p falls to 97.3 FPS at 4K, a 58% reduction. The High preset shows a similar pattern, with 210.5 FPS at 1080p dropping to 88.9 FPS at 4K, a 58% decline. Interestingly, the Ultra preset exhibits the most dramatic scaling penalty: 136.5 FPS at 1080p plummets to 54.6 FPS at 4K, a 60% reduction. This suggests that Ultra settings introduce additional rendering complexity—likely more demanding shading and post-processing effects—that disproportionately taxes the GPU at higher resolutions.
The data reveals that the limiting component shifts based on resolution. At 1080p, the frame rates are exceptionally high across all presets, with even Ultra achieving 136.5 FPS. This indicates the CPU is not a bottleneck; the Ryzen 5 5600's 6 cores and 12 threads, with a boost clock of 4.40 GHz, provide ample headroom. However, at 4K, the GPU becomes the clear limiting factor, as the frame rate differences between presets widen considerably. The gap between Low and Ultra at 1080p is 158.6 FPS, but at 4K it narrows to 66.8 FPS, underscoring that the GPU's memory bandwidth and shading units are saturated regardless of settings at the highest resolution.
How This Combo Ranks
Within the benchmark database of 1705 tested CPU-GPU combinations, this pairing of the AMD Ryzen 5 5600 with the NVIDIA GeForce RTX 4070 Ti SUPER achieves a rank of 182 for Greedfall. This places the combo in the top 10.7% of all tested configurations, a strong showing for a mid-range CPU paired with a high-end GPU.
The GPU's individual percentile ranking of 86 versus all GPUs is notable. The RTX 4070 Ti SUPER, with its 16 GB of GDDR6X memory and 672.3 GB/s bandwidth, sits comfortably above most rivals. Its nearest competitors in the database include the NVIDIA CMP 50HX (0.7% higher average score) and the Intel Arc A550M (2.1% lower average score), indicating the GPU is performing as expected within its class.
The CPU's percentile ranking of 79 versus all CPUs is also respectable. The Ryzen 5 5600's nearest rivals include the Intel Xeon D-1746TER (0.6% higher score) and the Intel Core i7-11700F (0.9% lower score), showing that it holds its own against a range of server and desktop processors. However, the combo's overall rank of 182 suggests that in Greedfall, the GPU is the primary driver of performance, as the CPU's mid-tier ranking does not significantly drag down the combined result. The data indicates that this combo is well-balanced for the game, with neither component severely bottlenecking the other at typical gaming resolutions.
Settings Recommendations
The measured FPS rows provide clear guidance for optimal settings based on target refresh rates. For 1080p displays, the High preset at 210.5 FPS is more than sufficient for any high-refresh monitor, while Ultra at 136.5 FPS still offers excellent fluidity. Medium at 230.2 FPS offers diminishing returns over High, and Low at 295.1 FPS is unnecessary unless chasing absolute maximum frame rates.
At 1440p, the High preset delivers 145.3 FPS, which is ideal for 144 Hz displays. Ultra drops to 94.9 FPS, which remains playable but may not satisfy users with 144 Hz or higher monitors who prefer maximum visual fidelity. Medium at 158.1 FPS provides a slight edge over High, but the visual difference between Medium and High is typically more pronounced than the 12.8 FPS gain suggests. Low at 204.7 FPS is again overkill.
For 4K gaming, the situation changes dramatically. Ultra falls to 54.6 FPS, which is below the 60 FPS threshold many consider the minimum for smooth gameplay. High at 88.9 FPS is the clear sweet spot, offering a substantial improvement over Medium (97.3 FPS) in visual quality while maintaining a frame rate well above 60 FPS. Low at 121.4 FPS is playable but sacrifices too much visual detail for the extra performance. The recommendation is to use High settings for 4K, Medium or High for 1440p depending on refresh rate, and High or Ultra for 1080p.
Measured FPS Breakdown
At 1920x1080, the average frame rates across presets are as follows: Low delivers 295.1 FPS, Medium provides 230.2 FPS, High reaches 210.5 FPS, and Ultra achieves 136.5 FPS. The progression from Low to Ultra shows a steady decline, with the largest single step being the drop from High to Ultra, which represents a 74 FPS reduction. This indicates that Ultra settings impose a significant additional rendering load compared to High.
At 2560x1440, the measured averages are: Low at 204.7 FPS, Medium at 158.1 FPS, High at 145.3 FPS, and Ultra at 94.9 FPS. The scaling from 1080p to 1440p results in roughly a 30% reduction across all presets, consistent with the increased pixel count. The gap between High and Ultra at this resolution is 50.4 FPS, slightly less than at 1080p, suggesting that Ultra's additional effects are somewhat less impactful at higher resolutions.
At 3840x2160, the averages are: Low at 121.4 FPS, Medium at 97.3 FPS, High at 88.9 FPS, and Ultra at 54.6 FPS. The Ultra preset at 4K is the only configuration that falls below 60 FPS, making it the sole marginal choice for smooth gameplay. The drop from High to Ultra at 4K is 34.3 FPS, which is proportionally similar to the 1080p gap but smaller in absolute terms due to the lower baseline. These numbers confirm that the GPU's 16 GB memory buffer and 256-bit bus are sufficient for 4K, but the shading unit count (8448) and clock speeds (boost up to 2610 MHz) become the limiting factors at Ultra settings.
GPU Role
The NVIDIA GeForce RTX 4070 Ti SUPER plays the dominant role in determining Greedfall's performance, particularly at higher resolutions and settings. The GPU's 16 GB of GDDR6X memory with a 672.3 GB/s bandwidth is more than adequate for the game's textures, even at 4K Ultra, which typically demands significant memory capacity. The 256-bit memory bus ensures that data transfer does not become a bottleneck.
The GPU's architecture, Ada Lovelace, on a 5 nm process, includes 8448 shading units and 96 ROPs. The boost clock of 2610 MHz allows for high sustained throughput. Benchmark data shows the GPU achieving a Passmark G3D score of 31811 and a Geekbench OpenCL score of 223091, placing it in the 86th percentile of all GPUs. Its nearest rival, the NVIDIA CMP 50HX, scores 0.7% higher, while the RTX A2000 is 1.6% lower, indicating the 4070 Ti SUPER performs consistently with its specifications.
In Greedfall, the GPU's role is most evident in the 4K Ultra result of 54.6 FPS. This is the only measured instance where the frame rate dips below 60 FPS, suggesting that the combination of high resolution and the most demanding preset saturates the GPU's compute resources. The fact that 4K High achieves 88.9 FPS while 4K Ultra drops to 54.6 FPS indicates that Ultra settings likely enable additional ray-traced or high-fidelity effects that heavily tax the GPU's RT cores (66) and tensor cores (264). The GPU's TDP of 285 W and triple-slot design are consistent with a high-performance part, but the data shows that Ultra settings at 4K push it to its limits.
CPU Role
The AMD Ryzen 5 5600, with its 6 cores and 12 threads, provides a solid foundation for this combo. Its Zen 3 architecture, codenamed Vermeer, operates at a base clock of 3.50 GHz and boosts to 4.40 GHz. The CPU's 32 MB of shared L3 cache and 4,150 million transistors on a 7 nm process contribute to strong single-threaded performance, which is crucial for Greedfall's game logic and physics.
Benchmark results show the CPU achieving a Cinebench R23 multicore score of 18309 and a single-core score of 2584. Its Passmark single-thread score of 3256 and multithread score of 21541 place it in the 79th percentile of all CPUs. The nearest rival, the Intel Core i7-11700F, scores only 0.9% higher, demonstrating that the 5600 holds its own against a comparable desktop processor with more cores.
In Greedfall, the CPU's role is most apparent at 1080p Low, where the frame rate reaches 295.1 FPS. This high value indicates that the CPU is not a limiting factor at this resolution; the Ryzen 5 5600's 12 threads are sufficient to feed the GPU's frame buffer at rates exceeding 200 FPS. Even at 1080p Ultra, the CPU maintains 136.5 FPS, which is still above the refresh rate of most monitors. The data suggests that the CPU's 65 W TDP and dual-channel memory support (with 51.2 GB/s bandwidth) are adequate for the game's demands. However, it is notably the CPU's performance is not pushing the combo's rank higher; the GPU is clearly the more influential component in determining overall frame rates, as evidenced by the significant FPS drops when moving from 1440p to 4K across all settings.
Hardware Specifications
AMD Ryzen 5 5600
NVIDIA GeForce RTX 4070 Ti SUPER
FPS Benchmarks by Resolution & Settings
Performance data for AMD Ryzen 5 5600 + NVIDIA GeForce RTX 4070 Ti SUPER in Greedfall
| Resolution | Settings | Avg FPS |
|---|---|---|
| 3840x2160 | Low | 121.4 |
| 3840x2160 | Medium | 97.3 |
| 3840x2160 | High | 88.9 |
| 3840x2160 | Ultra | 54.6 |
| 2560x1440 | Low | 204.7 |
| 2560x1440 | Medium | 158.1 |
| 2560x1440 | High | 145.3 |
| 2560x1440 | Ultra | 94.9 |
| 1920x1080 | Low | 295.1 |
| 1920x1080 | Medium | 230.2 |
| 1920x1080 | High | 210.5 |
| 1920x1080 | Ultra | 136.5 |
Greedfall with Ryzen 5 5600 + Other GPUs
See how Greedfall performs with the same CPU but different graphics cards.
Greedfall with RTX 4070 Ti SUPER + Other CPUs
See how Greedfall performs with the same GPU but different processors.
Other Games with Ryzen 5 5600 + RTX 4070 Ti SUPER
Explore FPS benchmarks for other games using this same hardware combination.