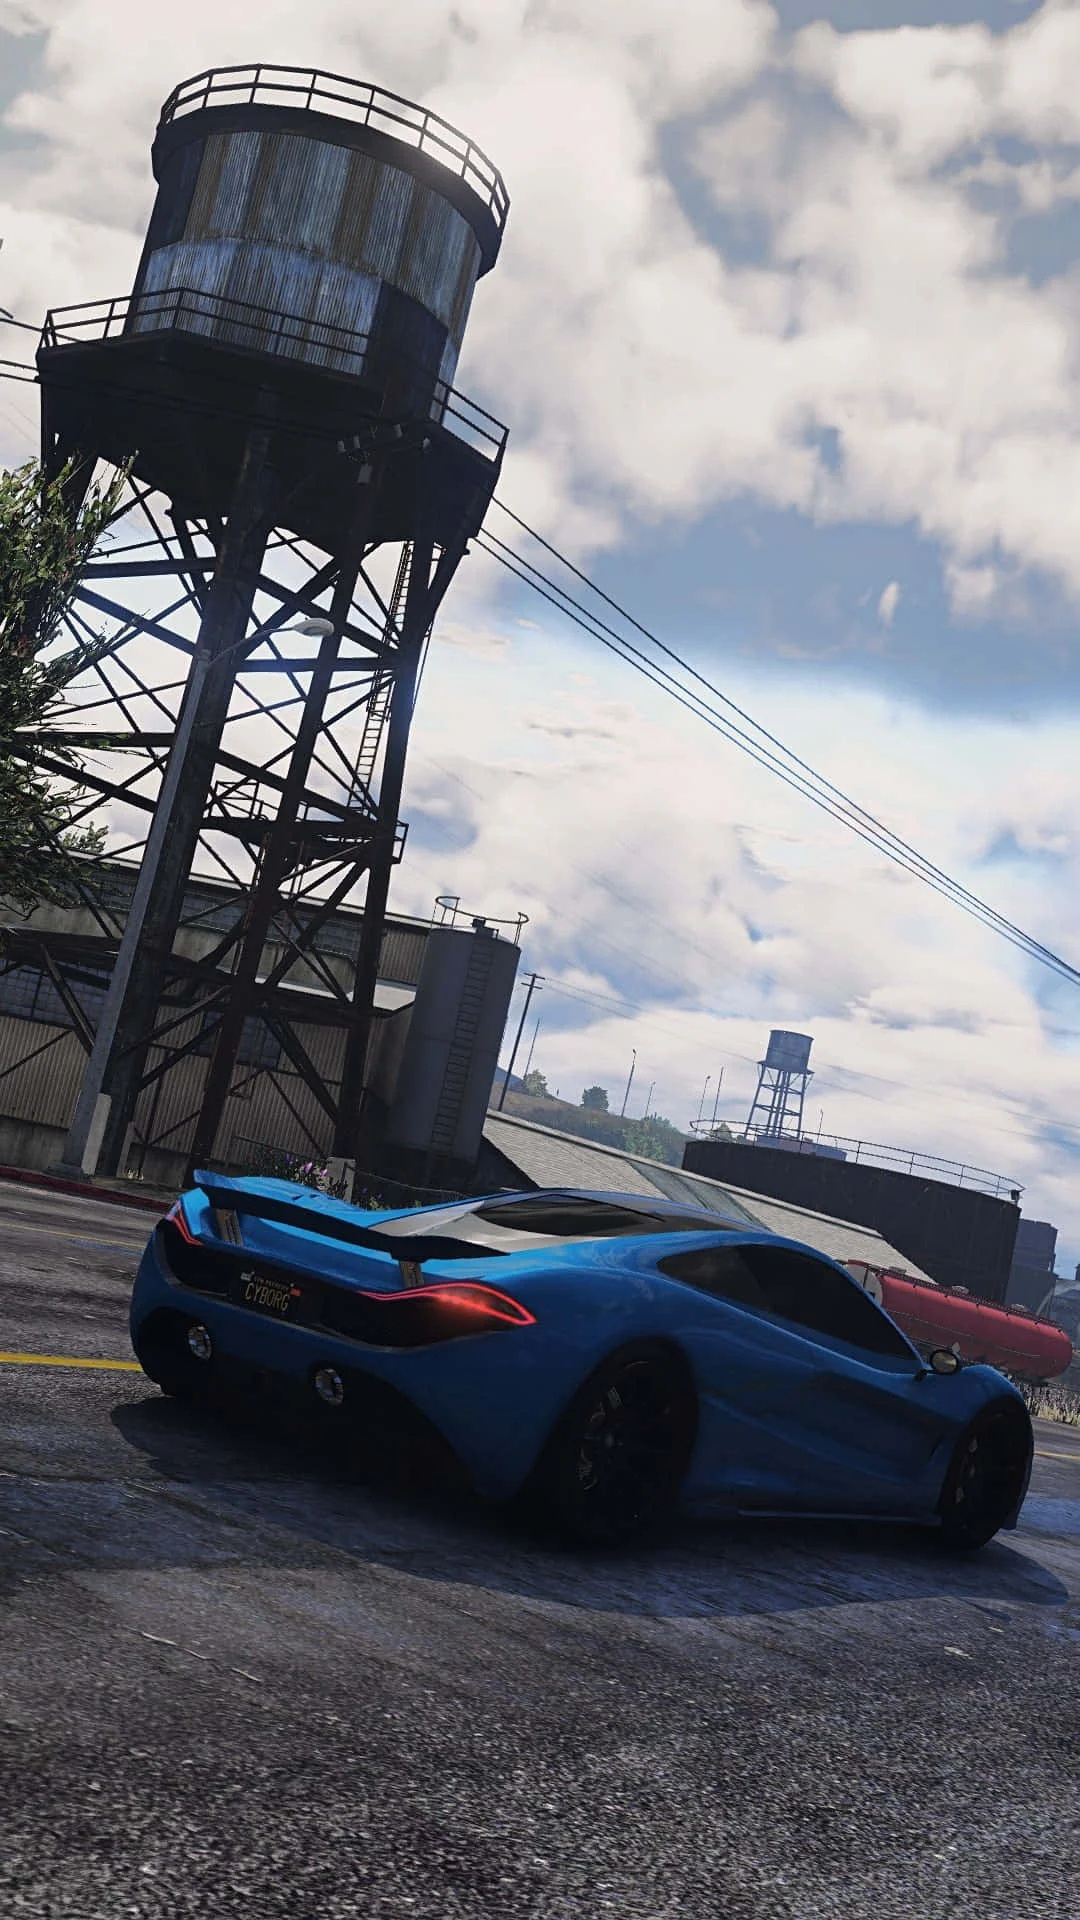
Fivem
This combination provides smooth gameplay with an average of 108 FPS, suitable for most gaming scenarios.
Average FPS: resolution vs quality settings
| Ultra | High | Medium | Low | |
|---|---|---|---|---|
| 4K Ultra HD | 42 | 53 | 61 | 82 |
| 1440p QHD | 69 | 93 | 112 | 144 |
| 1080p Full HD | 107 | 141 | 176 | 218 |
Cell color: green is 120+ FPS, teal is 60+, amber is 30+, red is below 30.
Fivem with Intel Core i5-13400F + NVIDIA GeForce RTX 4060 Ti 8 GB, In-Depth Analysis
The data for Fivem with the Intel Core i5-13400F and NVIDIA GeForce RTX 4060 Ti 8 GB shows a configuration that scales predictably across resolutions, with the GPU becoming the primary constraint as pixel count rises. The measured frames per second (FPS) reveal distinct performance tiers that shift from a CPU-limited state at 1080p to a heavily GPU-limited state at 4K.
Resolution Scaling
The transition from 1920x1080 to 3840x2160 produces a substantial performance drop that illustrates the changing bottleneck. At 1080p with High settings, the combo delivers 140.8 FPS, but at 4K with the same settings, it falls to 53.2 FPS—a reduction of 87.6 FPS, or roughly 62% lower. This pattern is consistent across all settings presets. For Low settings, the drop is even more pronounced in absolute terms: 218.4 FPS at 1080p falls to 81.9 FPS at 4K, a loss of 136.5 FPS. The Medium preset shows a similar trend, moving from 175.5 FPS to 60.5 FPS, while Ultra settings decline from 107.2 FPS to 42.1 FPS.
The scaling behavior indicates that at 1080p, the system has enough headroom to push very high frame rates, especially at lower presets. The 218.4 FPS result at Low settings suggests the CPU is capable of feeding the GPU well beyond typical 60 Hz displays. However, the 4K results—all below 82 FPS even at Low—demonstrate that the RTX 4060 Ti 8 GB cannot maintain high refresh rates at that resolution. The gap between the 1080p and 1440p results is narrower than the gap between 1440p and 4K, indicating a nonlinear scaling curve. From 1080p to 1440p at High settings, the drop is 48.3 FPS (140.8 to 92.5), while from 1440p to 4K, the drop is 39.3 FPS (92.5 to 53.2). The 4K results are closer to the 60 FPS target at Medium (60.5 FPS) but fall short at High (53.2 FPS) and Ultra (42.1 FPS).
GPU Role
The NVIDIA GeForce RTX 4060 Ti 8 GB is built on the Ada Lovelace architecture with a 5 nm process from TSMC. Its boost clock of 2535 MHz and base clock of 2310 MHz provide the computational foundation for the measured results. The GPU has 4352 shading units, 136 texture mapping units, and 48 raster output pipelines. Memory configuration includes 8 GB of GDDR6 on a 128-bit bus, yielding 288.0 GB/s of bandwidth. The 22.06 TFLOPS FP32 performance and 121.7 GPixel/s pixel rate are relevant to how the card handles Fivem’s rendering workload.
The VRAM capacity appears to be a limiting factor at higher resolutions and settings. At 4K Ultra, the average FPS drops to 42.1, which is the lowest result in the dataset. This suggests that the 8 GB frame buffer is under strain when rendering at 3840x2160 with maximum detail settings. The GPU’s benchmark percentile places it at 17, meaning it outperforms only 17% of all GPUs in the database. Its average benchmark score in the 3DMark Steel Nomad DX12 test is 2913, which is nearly identical to its nearest rival, the NVIDIA GeForce RTX 4060 Ti 16 GB, with a deltaPct of 0.2. This indicates that the 8 GB variant performs nearly the same as the 16 GB version in that synthetic test, but the real-world Fivem data shows the 8 GB capacity may still constrain 4K Ultra performance.
How This Combo Ranks
In the benchmark database, this specific combo achieves a rank of 735 out of 1792 tested combinations. This places it in the upper-middle portion of the distribution, meaning roughly 59% of tested combos perform better in Fivem. The rank reflects the balance between the CPU and GPU, where the CPU is relatively strong but the GPU’s 8 GB memory and overall performance level cap the system. The combo’s standing suggests that while it handles 1080p and 1440p well, it does not compete with high-end configurations that can maintain higher 4K frame rates.
The CPU’s percentile ranking is much higher than the GPU’s. The Intel Core i5-13400F sits at the 82nd percentile among all CPUs, whereas the GPU is at the 17th percentile. This disparity indicates that the GPU is the limiting factor in most scenarios, particularly at higher resolutions. The CPU’s average benchmark score of 25236 places it very close to its nearest rivals: the Intel Core i7-13620H (25201, deltaPct 0.1), AMD Ryzen 5 5600X3D (25365, deltaPct -0.5), AMD EPYC 9474F (25103, deltaPct 0.5), and AMD Ryzen AI 5 PRO 340 (25099, deltaPct 0.5). These tiny deltas show the i5-13400F is essentially tied with these other processors in general benchmark performance, which explains why the combo’s rank is not dragged down further by CPU limitations.
Measured FPS Breakdown
Examining the data resolution by resolution provides a clear picture of performance tiers. At 1920x1080, the Low preset achieves 218.4 FPS, which is the highest result in the entire dataset. Medium follows at 175.5 FPS, High at 140.8 FPS, and Ultra at 107.2 FPS. The spread from Low to Ultra is 111.2 FPS, showing that settings have a major impact at this resolution.
At 2560x1440, the results are 143.6 FPS for Low, 111.5 FPS for Medium, 92.5 FPS for High, and 68.7 FPS for Ultra. The Low preset still exceeds 144 FPS, which is sufficient for high-refresh-rate monitors, but the Ultra preset drops below 70 FPS. The gap between Low and Ultra at 1440p is 74.9 FPS.
At 3840x2160, the performance collapses relative to lower resolutions. Low settings produce 81.9 FPS, Medium gives 60.5 FPS, High yields 53.2 FPS, and Ultra falls to 42.1 FPS. Only the Low preset crosses the 60 FPS threshold, while Medium barely hits it and High and Ultra fall short. The spread from Low to Ultra at 4K is 39.8 FPS, which is smaller than at other resolutions. This compression indicates that at 4K, the GPU is the bottleneck regardless of settings, and reducing settings yields diminishing returns.
CPU Role
The Intel Core i5-13400F is a 10-core, 16-thread processor from the Raptor Lake architecture. Its base clock is 2.50 GHz with a boost clock of 4.60 GHz. The CPU has a 20 MB shared L3 cache and 1.25 MB L2 per core. It supports both DDR4 and DDR5 memory over a dual-channel bus. The processor’s 65 W TDP is modest, and it uses the Intel Socket 1700.
In synthetic benchmarks, the i5-13400F shows strong multithreaded performance. Cinebench R23 multicore scores 21279, while the single-core score is 3004. Geekbench multicore is 10971 and single-core is 2301. The 3DMark tests show scaling from 1880 for 2 threads to 7314 for 16 threads, with a max threads score of 7307. These results indicate that the CPU has ample headroom for gaming workloads, which typically rely on single-core performance. The PassMark single-thread score of 3634 confirms this, while the multithread score of 25032 shows the CPU can handle heavy multi-threaded tasks.
The CPU’s role in Fivem is evident when comparing the 1080p Low result of 218.4 FPS to the 4K Low result of 81.9 FPS. The fact that 1080p can exceed 200 FPS demonstrates that the CPU is not the limiting factor at that resolution. At 4K, the GPU’s inability to render frames fast enough becomes the constraint. The CPU’s high percentile ranking (82) relative to the GPU (17) reinforces that the processor is not holding back the system in most scenarios. However, the CPU’s boost clock of 4.60 GHz and 10 cores provide enough single-thread throughput to avoid becoming a bottleneck even at lower resolutions where frame rates are highest.
FAQ
Q: What is the best settings preset for 60 FPS at 4K?
A: At 3840x2160, the Medium preset achieves 60.5 FPS, which is just above the 60 FPS target. The Low preset reaches 81.9 FPS, while High falls below at 53.2 FPS and Ultra at 42.1 FPS.
Q: How does the RTX 4060 Ti 8 GB compare to the 16 GB version in synthetic benchmarks?
A: In the 3DMark Steel Nomad DX12 test, the 8 GB version scores 2913, while the 16 GB version scores 2907, a deltaPct of 0.2. The 8 GB card is effectively tied with the 16 GB card in this test.
Q: Is the CPU or GPU the bottleneck at 1080p with Low settings?
A: The 1080p Low result of 218.4 FPS suggests the GPU is processing frames quickly, and the CPU’s strong single-thread score of 3634 in PassMark indicates it can keep up. The GPU percentile of 17 shows the graphics card is relatively weak, but at this resolution it still delivers very high frame rates.
Q: What is the combo’s rank among all tested configurations?
A: The combo ranks 735 out of 1792 tested combos in Fivem, placing it in the upper-middle portion of the distribution.
Q: How much does the average FPS drop from 1080p to 4K at High settings?
A: The drop is from 140.8 FPS at 1920x1080 to 53.2 FPS at 3840x2160, a reduction of 87.6 FPS or approximately 62%.
Q: What is the CPU’s launch MSRP?
A: The Intel Core i5-13400F has a launch MSRP of $196.
Hardware Specifications
Intel Core i5-13400F
NVIDIA GeForce RTX 4060 Ti 8 GB
FPS Benchmarks by Resolution & Settings
Performance data for Intel Core i5-13400F + NVIDIA GeForce RTX 4060 Ti 8 GB in Fivem
| Resolution | Settings | Avg FPS |
|---|---|---|
| 3840x2160 | Low | 81.9 |
| 3840x2160 | Medium | 60.5 |
| 3840x2160 | High | 53.2 |
| 3840x2160 | Ultra | 42.1 |
| 2560x1440 | Low | 143.6 |
| 2560x1440 | Medium | 111.5 |
| 2560x1440 | High | 92.5 |
| 2560x1440 | Ultra | 68.7 |
| 1920x1080 | Low | 218.4 |
| 1920x1080 | Medium | 175.5 |
| 1920x1080 | High | 140.8 |
| 1920x1080 | Ultra | 107.2 |
Fivem with RTX 4060 Ti 8 GB + Other CPUs
See how Fivem performs with the same GPU but different processors.
Other Games with ii5-13400F + RTX 4060 Ti 8 GB
Explore FPS benchmarks for other games using this same hardware combination.