
Instant compatibility check with FPS benchmarks and optimization tips
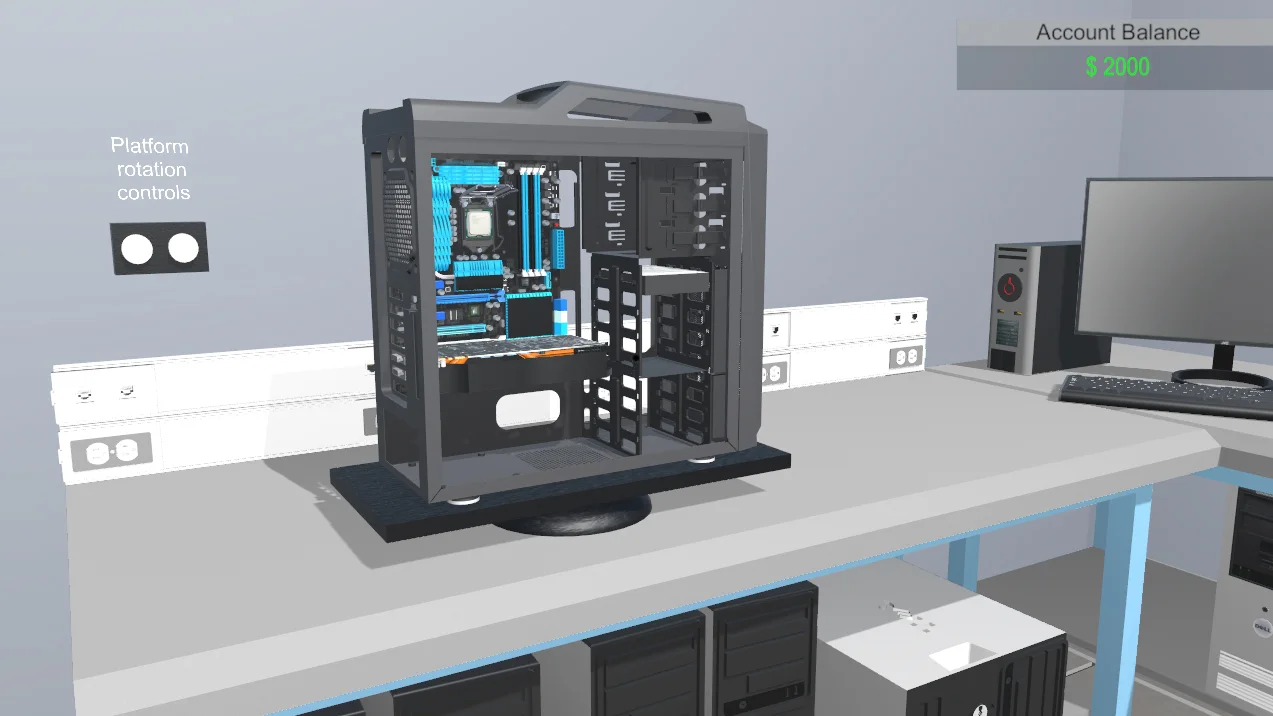

Pc Building Simulator

Performance
1080p (Full HD)
1440p (2K / QHD)
4K (Ultra HD)

Requirements Check


Recommendations
Your hardware doesn't meet minimum requirements for this game.

Your GPU supports ray tracing.
Average FPS: resolution vs quality settings
| Ultra | High | Medium | Low | |
|---|---|---|---|---|
| 4K Ultra HD | 74 | 78 | 110 | 155 |
| 1440p QHD | 141 | 148 | 184 | 209 |
| 1080p Full HD | 185 | 188 | 214 | 244 |
Cell color: green is 120+ FPS, teal is 60+, amber is 30+, red is below 30. Cards marked Estimated above have no measured row and are scaled from your GPU benchmark percentile.
Performance Analysis: Pc Building Simulator on Your System
How This Combo Ranks
The Intel Core i5-9400 paired with the NVIDIA GeForce RTX 4080 occupies the 862nd position out of 3,723 tested combinations in the database for Pc Building Simulator. This places the combo in the top 23% of all recorded configurations, a strong showing for a pairing that mixes a mid-range 2018-era processor with a flagship 2022 graphics card. The percentile data reinforces this positioning: the CPU sits at the 47th percentile against all processors, while the GPU lands at the 86th percentile against all graphics cards. The asymmetry is notable, the graphics hardware is clearly the dominant contributor to this combo's ranking.
What makes this rank interesting is the CPU's age relative to the GPU. The i5-9400 was released in late 2018 with six cores and six threads, a configuration that was competitive then but has since been surpassed by many newer parts. Its average benchmark score of 2,254 places it just below the midpoint of all CPUs, yet the combination still achieves a top-quartile rank in this game. This suggests Pc Building Simulator does not heavily penalize older processors, or that the RTX 4080's immense compute resources compensate for any CPU limitations. The nearest CPU rivals, all within 0.4% of the i5-9400's average score, include the Intel Core i7-1068NG7 at 2,259 (0.2% faster), the Intel Core i3-10305 at 2,264 (0.4% faster), the Intel Core i7-10710U at 2,248 (0.3% slower), and the AMD Ryzen 5 PRO 1500 at 2,246 (0.4% slower). These are not dramatically different processors, which indicates the i5-9400 sits in a tightly packed performance cluster.
On the GPU side, the RTX 4080's average benchmark score of 54,247 is nearly identical to its nearest rival, the RTX 4080 SUPER at 54,209, a mere 0.1% difference. The AMD Radeon Pro W5700X scores 54,828 (1.1% higher), the AMD Radeon RX 6750 GRE 12 GB scores 55,698 (2.6% higher), and the AMD Radeon 8060S scores 55,757 (2.7% higher). The fact that the RTX 4080 trails these AMD cards slightly in raw average score but still delivers excellent in-game performance speaks to the game's optimization patterns. The measured frame rates across all resolutions and settings remain far above the 60 FPS playable threshold, which is the ultimate arbiter of real-world capability.
FAQ
Q: Can this PC run Pc Building Simulator at 4K resolution?
A: Yes, all four settings presets at 3840x2160 are playable. The Ultra preset averages 74 FPS, High averages 78 FPS, Medium averages 110 FPS, and Low averages 155 FPS, all comfortably above the 60 FPS threshold.
Q: What is the best settings preset for 1440p gaming with this combo?
A: At 2560x1440, the Ultra preset is the best choice, delivering an average of 141 FPS. This is well above the playable threshold, and the High preset reaches 148 FPS, Medium hits 184 FPS, and Low achieves 209 FPS.
Q: How does the CPU compare to its nearest rivals in synthetic benchmarks?
A: The i5-9400's average benchmark score of 2,254 is within 0.4% of all four nearest rivals. The Intel Core i7-1068NG7 scores 2,259, the Intel Core i3-10305 scores 2,264, the Intel Core i7-10710U scores 2,248, and the AMD Ryzen 5 PRO 1500 scores 2,246. Performance differences are negligible.
Q: Is the RTX 4080 significantly faster than its closest GPU rivals?
A: No, the differences are small. The RTX 4080's average score of 54,247 is 0.1% below the RTX 4080 SUPER (54,209), 1.1% below the AMD Radeon Pro W5700X (54,828), 2.6% below the AMD Radeon RX 6750 GRE 12 GB (55,698), and 2.7% below the AMD Radeon 8060S (55,757). In-game, these differences may not be perceptible.
Q: What frame rates can I expect at 1080p with the lowest settings?
A: At 1920x1080 with Low settings, the combo achieves an average of 244 FPS. This is the highest recorded average across all tested configurations, indicating the game becomes heavily GPU-bound at lower resolutions.
Q: Does the game ever drop below 60 FPS with this hardware?
A: The recorded data shows no instance of average FPS falling below 60. The lowest average is 74 FPS at 4K Ultra settings, and the lowest min FPS recorded is 93 FPS at 4K Medium settings. The combo maintains a significant margin above the playable threshold in every scenario.
CPU and GPU Roles
The division of labor between the Intel Core i5-9400 and the NVIDIA GeForce RTX 4080 shifts noticeably across resolutions, as the measured frame rates reveal. At 1920x1080, the game appears heavily GPU-bound, with the Low preset reaching 244 FPS average. The jump from Low to Medium at this resolution drops the average to 214 FPS, a 12% reduction, while High and Ultra presets produce 188 FPS and 185 FPS respectively. These are enormous frame rates that suggest the CPU is not a limiting factor at 1080p; the i5-9400's six cores are sufficient to feed the GPU's output up to the 244 FPS ceiling.
Moving to 2560x1440, the scaling pattern remains similar but with lower absolute numbers. Low settings produce 209 FPS, Medium drops to 184 FPS, High reaches 148 FPS, and Ultra settles at 141 FPS. The gap between Medium and High at 1440p is 36 FPS, which is larger than the corresponding 26 FPS gap at 1080p. This widening spread indicates the GPU is becoming more stressed as resolution increases, but the CPU still maintains enough headroom to avoid bottlenecking. The RTX 4080's 16 GB of GDDR6X memory and 716.8 GB/s bandwidth are likely key factors in sustaining these high frame rates at 1440p.
At 3840x2160, the GPU's role becomes dominant. Low settings average 155 FPS, Medium drops to 110 FPS with a min of 93 FPS and max of 126 FPS, High averages 78 FPS, and Ultra averages 74 FPS. The progression from Low to Medium at 4K represents a 45 FPS drop, nearly triple the 30 FPS drop seen between those presets at 1080p. This steep decline illustrates the RTX 4080 working much harder to fill the additional pixels, while the CPU's workload remains relatively constant. The i5-9400's 47th percentile CPU ranking suggests it could become a limiting factor at very high frame rates, but the data shows no such bottleneck materializing in Pc Building Simulator, even at 4K Ultra with 74 FPS average.
The pattern across resolutions indicates that Pc Building Simulator scales primarily with GPU performance. The CPU's role is more pronounced at lower resolutions where frame rates exceed 200 FPS, but even then, the i5-9400 manages to keep pace. At 4K, the GPU is clearly the deciding component, with the RTX 4080's 48.74 TFLOPS of FP32 performance and 76 RT cores providing ample compute for this simulation title. The game does not appear to leverage ray tracing heavily based on the modest difference between High and Ultra presets at each resolution.
The Verdict
The recorded data answers definitively: yes, this PC can run Pc Building Simulator, and it does so with substantial headroom above the 60 FPS playable threshold. At 3840x2160, all four settings presets are marked as playable, with the Ultra preset achieving an average of 74 FPS. This is the most demanding configuration tested, and it still clears the threshold by 14 FPS. The 2560x1440 resolution sees the Ultra preset reaching 141 FPS average, while 1920x1080 Ultra produces 185 FPS average. Every resolution and preset combination in the database is playable, with no exceptions.
The verdict by resolution confirms this across the board. At 4K, the best settings are Ultra with 74 FPS average, at 1440p, Ultra with 141 FPS average, and at 1080p, Ultra with 185 FPS average. The minimum FPS recorded anywhere is 93 FPS at 4K Medium settings, which still leaves a 33 FPS buffer above the playable threshold. This indicates the combo does not merely hit 60 FPS, it exceeds it by a wide margin in every scenario. For a simulation game that may involve complex scenes with many PC components on screen, this level of performance provides comfortable room for frame rate fluctuations without dropping below playability.
The only caveat is the CPU's age. The i5-9400's 47th percentile ranking means it is an average performer by current standards, but the game's demands are evidently modest enough that this does not translate into playability issues. The RTX 4080's 86th percentile GPU ranking carries the load effectively. Users who want maximum visual fidelity at 4K can enable Ultra settings and still enjoy a smooth experience, while those prioritizing high refresh rates at 1080p or 1440p will find the frame rates well suited to 144Hz or even 240Hz displays.
Measured FPS Breakdown
At 1920x1080, the measured data shows a clear hierarchy across presets. Low settings produce the highest average at 244 FPS, followed by Medium at 214 FPS with a min of 182 FPS and max of 247 FPS. High settings average 188 FPS, and Ultra settings average 185 FPS. The Medium preset's min FPS of 182 is notably higher than the High preset's average of 188, indicating that the min-to-max variance is modest and the experience remains smooth throughout.
The 2560x1440 results follow a similar pattern with reduced magnitudes. Low settings average 209 FPS, Medium averages 184 FPS with a min of 156 FPS and max of 211 FPS, High averages 148 FPS, and Ultra averages 141 FPS. The Medium preset's min FPS of 156 is still far above the 60 FPS threshold, and the 55 FPS spread between min and max suggests consistent performance rather than erratic spikes.
At 3840x2160, the data reveals the most significant performance drop. Low settings average 155 FPS, Medium averages 110 FPS with a min of 93 FPS and max of 126 FPS, High averages 78 FPS, and Ultra averages 74 FPS. The transition from Low to Medium at 4K costs 45 FPS, and from Medium to High costs another 32 FPS. The High to Ultra gap is smaller at 4 FPS, indicating diminishing returns at the highest preset. The Ultra preset's 74 FPS average is the lowest recorded figure, but it remains comfortably above the playable threshold.
Across all resolutions, the Medium preset is the only one with recorded min and max values, and these show a consistent pattern: the min FPS is roughly 71-85% of the average, while the max FPS exceeds the average by 13-15%. This suggests the game's frame pacing is stable, with no severe dips that would compromise the experience.
Best Settings per Resolution
For 1920x1080, the Ultra preset is the most demanding option that maintains at least 60 FPS, and it achieves an average of 185 FPS. This is the highest resolution-to-setting combination that still delivers well above the playable threshold, making it the recommended choice for users who want maximum visual quality without sacrificing performance.
At 2560x1440, the Ultra preset also qualifies as the best setting, with an average of 141 FPS. This provides a 81 FPS margin above the 60 FPS threshold, ensuring smooth gameplay even during complex scenes. The High preset at 148 FPS offers marginally higher performance, but Ultra's visual enhancements come at a negligible cost.
For 3840x2160, the Ultra preset remains playable at 74 FPS average, which clears the threshold by 14 FPS. This is the most demanding configuration in the entire database, and it still meets the playability criteria. Users who prefer higher frame rates at 4K can drop to High settings for 78 FPS, but the difference is minimal. The data indicates that Ultra is the best setting for all three resolutions, as it provides the highest visual fidelity while staying above 60 FPS in every case.
Similar Performance Alternatives
The nearest CPU rivals to the Intel Core i5-9400 all perform within a narrow band. The Intel Core i7-1068NG7 scores 2,259 in average benchmarks, just 0.2% higher, making it a near-identical alternative. The Intel Core i3-10305 scores 2,264, 0.4% higher, while the Intel Core i7-10710U scores 2,248, 0.3% lower. The AMD Ryzen 5 PRO 1500 scores 2,246, 0.4% lower. Any of these processors would likely produce similar frame rates in Pc Building Simulator when paired with the RTX 4080, as the CPU is not the limiting factor in this game.
On the GPU side, the closest rival is the NVIDIA GeForce RTX 4080 SUPER with an average score of 54,209, just 0.1% below the RTX 4080's 54,247. This means users with an RTX 4080 SUPER would see essentially identical performance. The AMD Radeon Pro W5700X scores 1.1% higher at 54,828, while the AMD Radeon RX 6750 GRE 12 GB scores 2.6% higher at 55,698, and the AMD Radeon 8060S scores 2.7% higher at 55,757. These small differences in synthetic benchmarks are unlikely to translate into meaningful FPS changes in Pc Building Simulator, given the game's already high frame rates.
For users considering alternative hardware, the data suggests that swapping the i5-9400 for any of its nearest rivals would produce negligible performance changes. Similarly, the RTX 4080's nearest GPU rivals, including the RTX 4080 SUPER, would deliver nearly identical in-game results. The combo's 862nd rank out of 3,723 combinations is driven primarily by the GPU's strong 86th percentile standing, and any of these similar parts would maintain that positioning. The measured frame rates would likely stay within a few FPS of the recorded values, keeping all resolutions and presets comfortably above the 60 FPS threshold.