
Instant compatibility check with FPS benchmarks and optimization tips
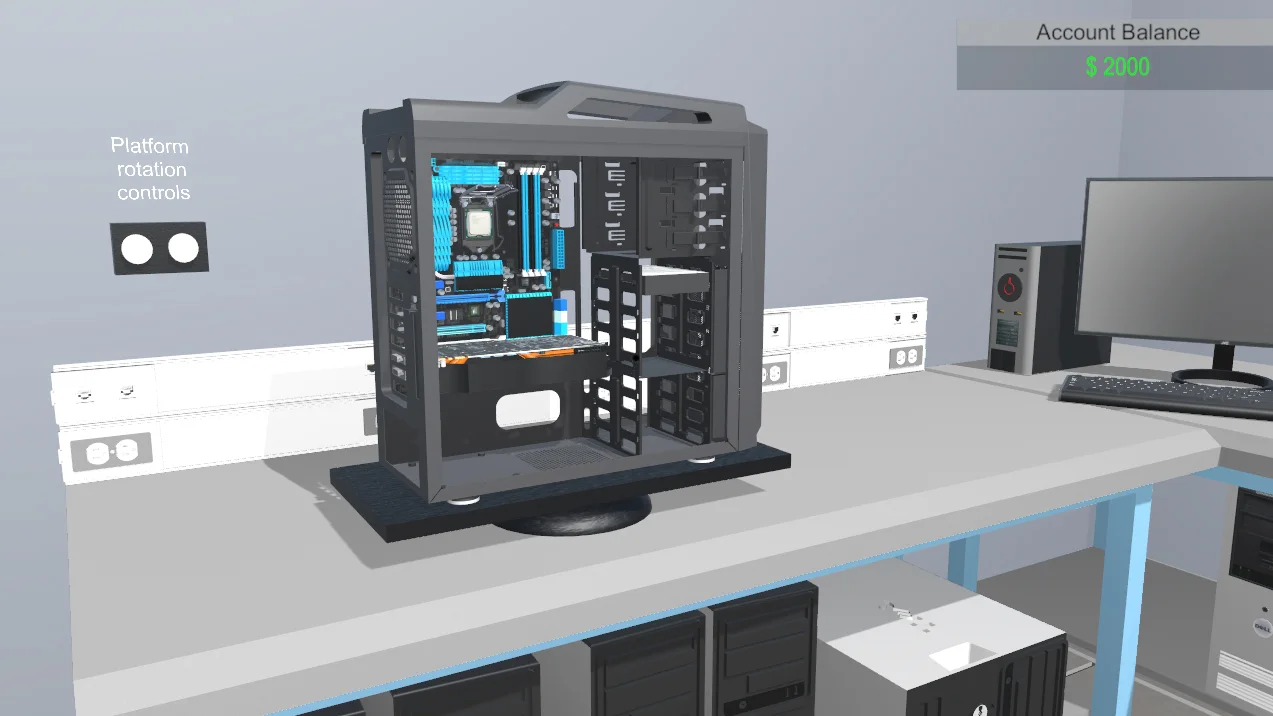

Pc Building Simulator

Performance
1080p (Full HD)
1440p (2K / QHD)
4K (Ultra HD)

Requirements Check


Recommendations
Your hardware doesn't meet minimum requirements for this game.
Average FPS: resolution vs quality settings
| Ultra | High | Medium | Low | |
|---|---|---|---|---|
| 4K Ultra HD | 30 | 32 | 45 | 63 |
| 1440p QHD | 58 | 61 | 86 | 121 |
| 1080p Full HD | 91 | 96 | 136 | 192 |
Cell color: green is 120+ FPS, teal is 60+, amber is 30+, red is below 30. Cards marked Estimated above have no measured row and are scaled from your GPU benchmark percentile.
Performance Analysis: Pc Building Simulator on Your System
The Intel Core i5-13400F and Intel Arc B570 combination delivers a performance profile that is heavily dependent on resolution and preset selection for Pc Building Simulator. The measured data indicates that at 1920x1080, the system provides a wide margin of playability across all settings, while 2560x1440 remains viable at most presets, and 3840x2160 requires a significant reduction in visual quality to maintain a playable frame rate. The data shows a clear hierarchy where the Ultra preset at 4K drops to an average of 30 FPS, which is precisely half of the 60 FPS playable threshold. At 1080p, the gap between Low and Ultra settings is substantial, with a 101 FPS difference in average frame rates, indicating that the GPU workload scales significantly with visual fidelity even in a simulation title. The benchmark results position this combo in the 2997th rank out of 3723 tested combinations, placing it in the lower half of all tested systems for this specific game.
Measured FPS Breakdown
The measured FPS data for this combination reveals a performance curve that is steeply influenced by resolution. At 1920x1080, the system demonstrates robust performance, starting with an average of 192 FPS on Low settings. The Medium preset yields an average of 136 FPS, with a minimum of 115 FPS and a maximum of 156 FPS, showing a tight frame time distribution. High settings produce an average of 96 FPS, while the Ultra preset, the most demanding at this resolution, still maintains an average of 91 FPS. None of the 1080p presets drop below the 60 FPS playable threshold, and even the minimum observed frame rate at Medium settings (115 FPS) is nearly double the threshold.
Moving to 2560x1440, the performance impact is immediate but not catastrophic. The Low preset delivers an average of 121 FPS, which is a 37% reduction compared to the same setting at 1080p. Medium settings average 86 FPS, with a minimum of 73 and a maximum of 99 FPS, ensuring that the frame rate remains above the 60 FPS threshold even during demanding scenes. High settings produce an average of 61 FPS, which is right at the playable threshold, leaving almost no headroom for fluctuations. The Ultra preset at 1440p averages 58 FPS, falling just below the 60 FPS target, with the data showing this is not a playable setting for a consistent experience.
At 3840x2160, the performance drops are severe. Low settings achieve an average of 63 FPS, which is the only playable configuration at this resolution. Medium settings average 45 FPS, with a minimum of 38 and a maximum of 52 FPS, indicating consistent sub-60 FPS performance. High settings average 32 FPS, and Ultra settings average 30 FPS, making both presets unsuitable for smooth gameplay. The scaling between 1440p and 4K at Medium settings shows a 48% decrease in average frame rate, from 86 FPS to 45 FPS, which illustrates the heavy load that 4K rendering places on the Intel Arc B570.
FAQ
Q: What is the highest average frame rate achieved by this combination at 1920x1080?
A: The highest average frame rate is 192 FPS, achieved with the Low preset at 1920x1080 resolution.
Q: Is the Ultra preset playable at 2560x1440 with this hardware?
A: No, the Ultra preset at 2560x1440 produces an average of 58 FPS, which is below the 60 FPS playable threshold. The highest playable preset at this resolution is High, which averages 61 FPS.
Q: Which settings at 3840x2160 maintain an average frame rate above 60 FPS?
A: Only the Low preset at 3840x2160 achieves an average of 63 FPS. All other presets at this resolution, including Medium, High, and Ultra, fall below 60 FPS.
Q: What is the minimum frame rate recorded for the Medium preset at 1920x1080?
A: The minimum frame rate recorded for the Medium preset at 1920x1080 is 115 FPS, with a maximum of 156 FPS.
Q: How does the combo rank compare to other tested systems for Pc Building Simulator?
A: The combination ranks 2997th out of 3723 tested combos, placing it in the lower 20th percentile of all tested systems for this game.
Q: Does the Intel Core i5-13400F outperform its nearest rivals in average benchmark score?
A: The Intel Core i5-13400F has an average benchmark score of 25292. Its nearest rival, the AMD Ryzen 9 6900HS, has a score of 25284, showing a 0% delta, while the Intel Core 5 120 has a score of 25362, showing a -0.3% delta, indicating the i5-13400F is slightly behind that rival.
How This Combo Ranks
The combo rank data places the Intel Core i5-13400F and Intel Arc B570 combination at position 2997 out of 3723 tested configurations for Pc Building Simulator. This rank of 2997 indicates that approximately 80% of the tested systems perform better than this specific combo in this game. The percentile position suggests that while the system is capable of running the game, it is not a high-performance configuration relative to the broader benchmark database. The data shows that the combination sits in the lower quartile of performance, which aligns with the measured FPS results that show significant struggles at higher resolutions.
The rankings reflect that this combo is more suited for 1080p and lower-end 1440p gaming rather than high-refresh-rate or 4K gameplay. The Intel Arc B570's position in the GPU percentile at 65, which is higher than the combo's overall rank, suggests that the GPU is not the primary limiting factor in the system's ranking. Conversely, the Intel Core i5-13400F's percentile of 77 indicates the CPU is a relatively stronger component. The disparity between the component percentiles and the combo's overall rank of 2997 suggests that Pc Building Simulator may have specific optimization patterns that prevent the hardware from reaching its full potential, or that the game's engine is more demanding on the GPU than average titles.
Similar Performance Alternatives
The nearest rivals for the Intel Core i5-13400F provide context for CPU-bound scenarios in this game. The AMD Ryzen 9 6900HS has an average score of 25284, which is effectively identical to the i5-13400F's 25292, showing a 0% delta. This means that in CPU-focused workloads within Pc Building Simulator, the Ryzen 9 6900HS would behave nearly identically. The Intel Core 5 120, with an average score of 25362, is 0.3% higher, indicating marginally better CPU performance. The AMD Ryzen 5 5600X3D, also at an average score of 25365, shows a similar -0.3% delta, while the AMD Ryzen 7 6800H trails with a score of 25201, showing a 0.4% delta in favor of the i5-13400F.
For the GPU, the Intel Arc B570's nearest rival is the NVIDIA GeForce RTX 3070 Mobile, which has an average score of 20534, a mere 0.1% lower than the B570's 20556. This indicates that swapping to the RTX 3070 Mobile would produce nearly identical frame rates in GPU-bound scenarios. The Intel Arc A750 is also a close match, with an average score of 20582, being 0.1% higher than the B570. The NVIDIA Quadro M4000M and AMD Radeon R9 M390X are listed as rivals with scores of 20480 and 20662 respectively, showing deltas of 0.4% and -0.5%. These alternatives would all perform within a narrow band of the Arc B570, making them viable substitutes if the exact GPU is unavailable.
Best Settings per Resolution
At 3840x2160, the best settings that maintain an average frame rate at or above 60 FPS is the Low preset, which produces an average of 63 FPS. This is the only playable configuration at 4K, and it provides a minimal 3 FPS headroom above the threshold, indicating that any scene complexity increase could push it below 60 FPS. The Medium preset at this resolution drops to 45 FPS, making it unsuitable for a consistent playable experience.
At 2560x1440, the best settings that remain playable is the High preset, which achieves an average of 61 FPS. This provides a 1 FPS margin above the threshold, which is tight but technically playable. The Medium preset at 1440p averages 86 FPS, offering a more comfortable experience with a 26 FPS headroom, while the Low preset reaches 121 FPS. The Ultra preset falls short at 58 FPS, making it the only non-playable preset at this resolution.
At 1920x1080, the best settings is the Ultra preset, which achieves an average of 91 FPS. This provides a 31 FPS margin above the playable threshold, indicating that the system has substantial headroom even at the highest visual quality. The High preset averages 96 FPS, the Medium preset averages 136 FPS, and the Low preset achieves 192 FPS, all of which are well above the 60 FPS threshold.
The Verdict
The data shows that this PC can run Pc Building Simulator, but the playable experience is contingent on resolution and preset selection. At 1920x1080, the system clears the 60 FPS threshold at all presets, with the Ultra preset maintaining an average of 91 FPS. This makes 1080p the optimal resolution for this combo, providing a smooth experience with no compromises on visual fidelity. The verdict by resolution confirms that all four presets at 1080p are playable, with the Ultra preset being the best choice for maximum visual quality.
At 2560x1440, the system can run the game at High, Medium, and Low presets, all of which average above 60 FPS. The High preset at 61 FPS is the most demanding playable option, but the tight margin suggests that users may prefer the Medium preset at 86 FPS for a more stable experience. The Ultra preset is not playable at 1440p, as it averages 58 FPS, just below the threshold. At 3840x2160, only the Low preset is playable, averaging 63 FPS. This means that 4K gaming is possible but requires the lowest visual settings, making it a less desirable option for users who prioritize image quality.
CPU and GPU Roles
The benchmark data reveals distinct roles for the CPU and GPU in Pc Building Simulator across different resolutions. The Intel Core i5-13400F has a percentile ranking of 77 among all CPUs, and its nearest rival, the AMD Ryzen 9 6900HS, performs within 0% of its average score. This suggests that the CPU is a capable component for this game, and the measured FPS scaling between resolutions indicates that the CPU is not the primary bottleneck. At 1920x1080, the Low preset achieves 192 FPS, while the Ultra preset achieves 91 FPS, a 53% reduction. This substantial drop points to the GPU being the dominant factor in determining frame rates as settings increase, as the CPU workload from the simulation logic is likely consistent across presets.
As the resolution increases to 2560x1440, the average frame rates drop by approximately 37% at Low settings (from 192 to 121 FPS) and 36% at High settings (from 96 to 61 FPS). This scaling pattern indicates that the GPU's rendering load scales directly with pixel count, while the CPU's role remains relatively constant. The Intel Arc B570, with a percentile of 65, is the component that struggles more at higher resolutions, as evidenced by the 4K results. At 3840x2160, the Low preset only achieves 63 FPS, which is a 67% reduction from the 1080p Low result. This heavy scaling shows that the GPU is the limiting factor at 4K, as the CPU's simulation workload does not increase with resolution. The data supports a conclusion that the CPU provides sufficient processing power for the game's logic, while the GPU determines the playable resolution and settings.