
Instant compatibility check with FPS benchmarks and optimization tips
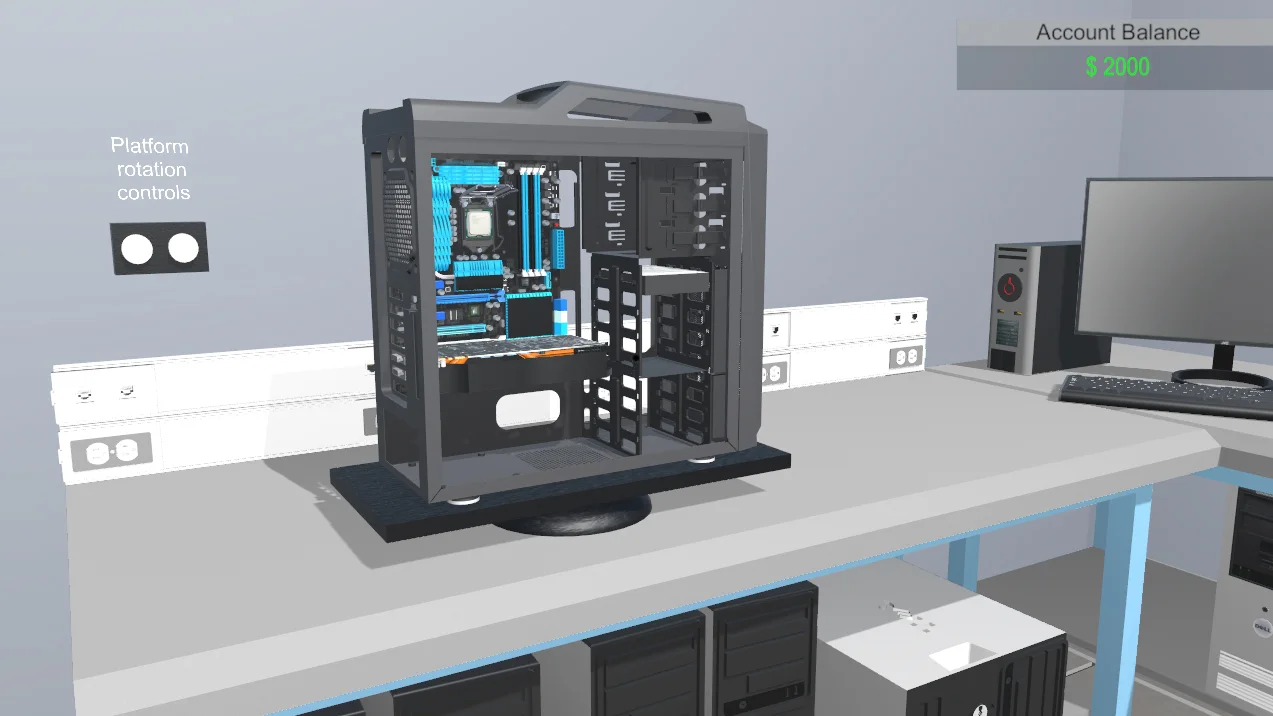

Pc Building Simulator

Performance
1080p (Full HD)
1440p (2K / QHD)
4K (Ultra HD)

Requirements Check


Recommendations
Your hardware doesn't meet minimum requirements for this game.
Average FPS: resolution vs quality settings
| Ultra | High | Medium | Low | |
|---|---|---|---|---|
| 4K Ultra HD | 18 | 19 | 26 | 37 |
| 1440p QHD | 34 | 36 | 50 | 71 |
| 1080p Full HD | 54 | 56 | 80 | 113 |
Cell color: green is 120+ FPS, teal is 60+, amber is 30+, red is below 30. Cards marked Estimated above have no measured row and are scaled from your GPU benchmark percentile.
Performance Analysis: Pc Building Simulator on Your System
Similar Performance Alternatives
The Intel Core i5-12600KF sits in a tightly contested performance band. Its average benchmark score of 27,799 places it within a fraction of a percent of several prominent processors. The closest rival is the AMD Ryzen 7 5800X3D, which scores 27,896, a delta of only -0.3% against the i5. The Intel Core i9-10900K posts 27,872, also -0.3%, meaning the i5-12600KF trades blows with a previous-generation flagship. The AMD Ryzen 7 6800U scores 27,887, again -0.3%, showing that even a mobile-oriented chip lands in the same performance envelope. The AMD Ryzen 5 8500GE is the only one of the four that scores slightly lower, at 27,712, a delta of +0.3% from the i5's perspective. In practical terms, any of these CPUs would deliver nearly identical frame rates in Pc Building Simulator, as the differences are well below one percent.
The Intel Arc B370 graphics solution is a different story. Its single recorded benchmark score is 1,184 in 3DMark Steel Nomad DX12, which places it at the 5th percentile of all GPUs in the database. The nearest rivals are all older discrete and mobile parts. The ATI Mobility Radeon HD 5570 scores 1,186, a delta of -0.2%, making it essentially a dead heat. The ATI Radeon HD 5770 scores 1,190, a delta of -0.5%. The AMD Radeon HD 7650M scores 1,192, a delta of -0.7%. The AMD FirePro M2000 scores 1,168, a delta of +1.4%, which is the largest gap in this group but still tiny. For the purposes of this game, users coming from any of those older graphics parts should expect the Arc B370 to behave almost identically.
FAQ
Q: Can this system run Pc Building Simulator at 1080p?
A: Yes. At 1920x1080, the combination delivers 113 FPS on Low, 80 FPS on Medium, and 56 FPS on High. The playable threshold is 60 FPS, so Low and Medium both clear it comfortably.
Q: What is the best 1440p setting for this PC?
A: The only playable preset at 2560x1440 is Low, which produces an average of 71 FPS. Medium drops to 50 FPS, High to 36 FPS, and Ultra to 34 FPS, all below the 60 FPS threshold.
Q: Is 4K playable with this hardware?
A: No. At 3840x2160, the best result is 37 FPS on Low, followed by 26 FPS on Medium, 19 FPS on High, and 18 FPS on Ultra. Every preset falls well short of 60 FPS.
Q: How does the CPU compare to its nearest rivals?
A: The i5-12600KF scores 27,799 on average. The AMD Ryzen 7 5800X3D, Intel Core i9-10900K, and AMD Ryzen 7 6800U all score within 0.3% of it, while the AMD Ryzen 5 8500GE sits 0.3% lower. Any of these chips would produce nearly indistinguishable results in this game.
Q: How does the GPU compare to its nearest rivals?
A: The Intel Arc B370 scores 1,184 in 3DMark Steel Nomad DX12. The ATI Mobility Radeon HD 5570 (1,186), ATI Radeon HD 5770 (1,190), AMD Radeon HD 7650M (1,192), and AMD FirePro M2000 (1,168) are all within 1.4% of that score.
Q: What is the overall rank of this combo?
A: This CPU and GPU pairing ranks 3,436 out of 3,723 tested combinations in Pc Building Simulator, placing it in the lower portion of the database.
Measured FPS Breakdown
At 1920x1080, the recorded data shows a clear progression across presets. Low settings produce an average of 113 FPS with no recorded minimum or maximum values. Medium settings yield 80 FPS on average, with a minimum of 68 FPS and a maximum of 92 FPS. High settings drop to 56 FPS average, while Ultra falls to 54 FPS. Neither High nor Ultra has recorded min/max values in the database.
Moving to 2560x1440, performance steps down noticeably. Low settings still deliver a playable 71 FPS average. Medium settings produce 50 FPS average, with a recorded range of 43 FPS minimum to 58 FPS maximum. High settings average 36 FPS, and Ultra averages 34 FPS. The gap between Low and Medium here is 21 FPS, which is substantial.
At 3840x2160, none of the presets approach the playable threshold. Low settings average 37 FPS. Medium settings average 26 FPS, with a range of 22 FPS minimum to 30 FPS maximum. High settings average 19 FPS, and Ultra averages 18 FPS. The difference between Low and Medium at 4K is 11 FPS, and the difference between High and Ultra is only 1 FPS.
The data reveals that the scaling from 1080p to 1440p is steep. At Low settings, the drop from 113 FPS to 71 FPS is 42 FPS, a reduction of roughly 37%. At Medium settings, the drop from 80 FPS to 50 FPS is 30 FPS. At High settings, the drop from 56 FPS to 36 FPS is 20 FPS. At Ultra, the drop from 54 FPS to 34 FPS is 20 FPS as well.
The scaling from 1440p to 4K is even harsher. Low settings fall from 71 FPS to 37 FPS, a 34 FPS reduction. Medium falls from 50 FPS to 26 FPS, a 24 FPS reduction. High falls from 36 FPS to 19 FPS, a 17 FPS reduction. Ultra falls from 34 FPS to 18 FPS, a 16 FPS reduction.
The Verdict
The database verdict for this PC is straightforward. At 1920x1080, the system clears the 60 FPS threshold on Low and Medium presets. The best playable setting at 1080p is Medium, with an average of 80 FPS. At 2560x1440, only Low settings achieve 60 FPS, with an average of 71 FPS. At 3840x2160, the verdict is clear: no settings are playable. The recorded playable settings list is empty for 4K, and the best settings field is null.
In short, this machine is a 1080p and low-preset 1440p system for Pc Building Simulator. It cannot sustain 60 FPS at 4K under any preset, and it cannot sustain 60 FPS at 1440p on anything above Low. The measured FPS data supports this conclusion directly: every 4K result is below 40 FPS, and every 1440p result above Low is below 60 FPS.
Best Settings per Resolution
At 1920x1080, the most demanding preset that stays at or above 60 FPS is Medium, with an average of 80 FPS. This is the recommended ceiling for a smooth experience at this resolution. Low also clears the threshold with 113 FPS, but Medium offers a better balance of visual quality and performance.
At 2560x1440, the only preset that stays at or above 60 FPS is Low, with an average of 71 FPS. Medium falls to 50 FPS, which is below the playable threshold. Users targeting 1440p must accept Low settings to maintain 60 FPS.
At 3840x2160, there is no preset that stays at or above 60 FPS. The highest average recorded is 37 FPS on Low. The best settings field in the verdict data is null for this resolution, confirming that no playable configuration exists.
How This Combo Ranks
The Intel Core i5-12600KF and Intel Arc B370 combination ranks 3,436 out of 3,723 tested combos in Pc Building Simulator. This places it in the bottom 8% of all tested configurations. The rank reflects the GPU's severe limitation: the Arc B370 sits at the 5th percentile of all GPUs, and its nearest rivals are all legacy parts from the HD 5000 and HD 7000 series. The CPU, by contrast, is a strong performer at the 79th percentile of all CPUs, but in this game the graphics component dominates the outcome at higher resolutions.
The combination of a high-tier CPU and a very low-tier GPU creates an unusual profile. In CPU-bound scenarios, the i5-12600KF would excel, but Pc Building Simulator at 4K and even 1440p appears heavily constrained by the graphics solution. The rank of 3,436 out of 3,723 is consistent with a system that can handle 1080p gaming but falls apart at higher resolutions.
CPU and GPU Roles
The data indicates that the GPU is the limiting factor in this pairing, especially at higher resolutions. The CPU's benchmark profile is strong: 23,391 in Cinebench R23 multi-core, 3,302 in single-core, and a 79th percentile rank among all CPUs. The GPU, however, scores only 1,184 in 3DMark Steel Nomad DX12 and ranks at the 5th percentile. When a system has this imbalance, the frame rate at high resolutions tends to collapse as pixel count increases.
The measured FPS across resolutions supports this interpretation. At 1080p Low, the system hits 113 FPS, which suggests the CPU can feed frames quickly when the GPU is not overwhelmed. At 1080p Medium, the average drops to 80 FPS, and at High it falls to 56 FPS. This pattern shows that the GPU struggles as the workload increases, even at 1080p.
At 1440p, the drop is more pronounced. Low settings fall to 71 FPS, and Medium to 50 FPS. The GPU simply cannot maintain 60 FPS on Medium at 1440p. At 4K, the situation is dire: even Low settings only produce 37 FPS. The scaling from resolution to resolution shows a GPU-bound system, where each step up in pixel count causes a large frame rate penalty.
The CPU's role becomes more apparent at 1080p Low, where 113 FPS indicates that the processor is capable of driving high frame rates. The i5-12600KF's multi-threaded score of 23,391 in Cinebench R23 and its 10-core, 16-thread configuration provide ample headroom for a simulation game. However, once the resolution increases and the GPU becomes the bottleneck, the CPU's strength no longer translates into higher frame rates.
The difference between presets also highlights the GPU's dominance. At 1080p, the gap between Low and Ultra is 59 FPS (113 to 54). At 1440p, the gap between Low and Ultra is 37 FPS (71 to 34). At 4K, the gap narrows to 19 FPS (37 to 18). This narrowing at higher resolutions suggests that the GPU is saturated even at Low settings in 4K, leaving little headroom for preset changes. The CPU, meanwhile, is never the primary constraint in this game at any resolution above 1080p Low.