
Instant compatibility check with FPS benchmarks and optimization tips
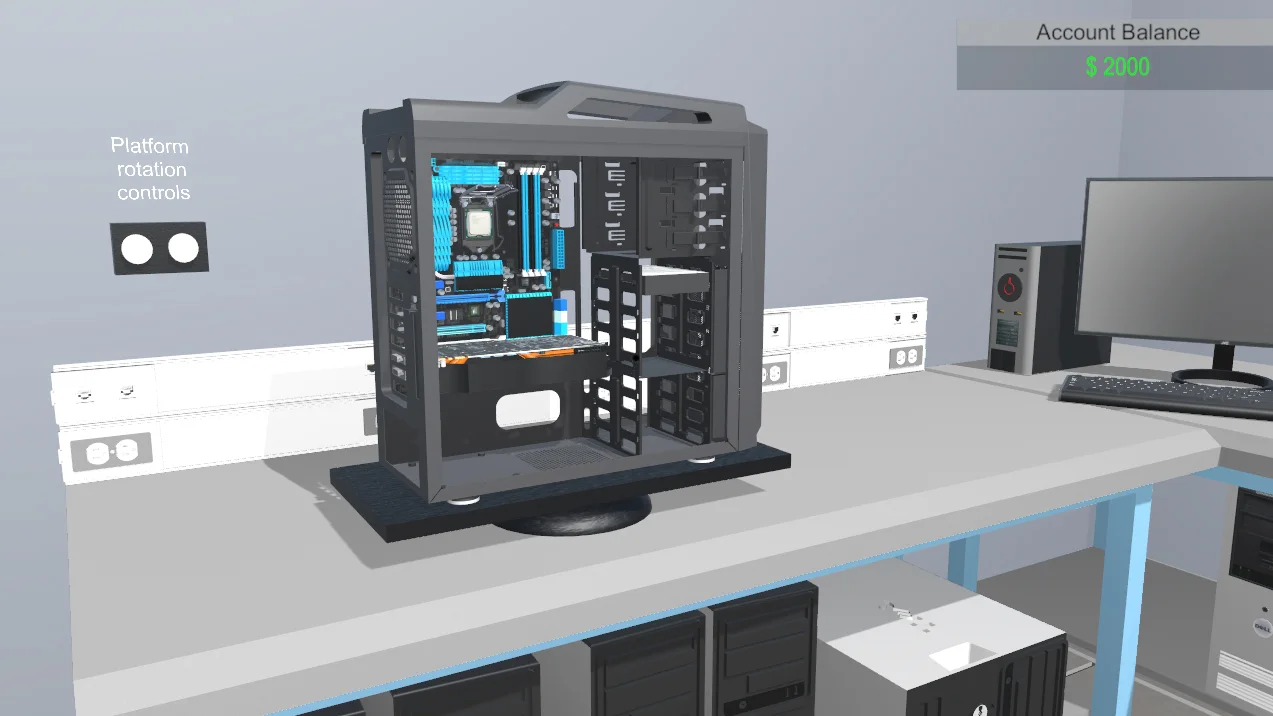

Pc Building Simulator

Performance
1080p (Full HD)
1440p (2K / QHD)
4K (Ultra HD)

Requirements Check


Recommendations
Your hardware doesn't meet minimum requirements for this game.

Your GPU supports ray tracing.
Average FPS: resolution vs quality settings
| Ultra | High | Medium | Low | |
|---|---|---|---|---|
| 4K Ultra HD | 43 | 47 | 61 | 85 |
| 1440p QHD | 83 | 84 | 121 | 169 |
| 1080p Full HD | 129 | 135 | 192 | 264 |
Cell color: green is 120+ FPS, teal is 60+, amber is 30+, red is below 30. Cards marked Estimated above have no measured row and are scaled from your GPU benchmark percentile.
Performance Analysis: Pc Building Simulator on Your System
The Intel Core i5-12400F paired with the NVIDIA GeForce RTX 4060 delivers a wide spread of frame rates in Pc Building Simulator, ranging from a demanding 42.7 FPS at 4K Ultra to a fluid 263.6 FPS at 1080p Low. Measured data shows that this combination is highly capable across most resolutions and presets, with the playable threshold of 60 FPS acting as the dividing line between the 4K experience and everything else. At 3840x2160, the combo manages 85.4 FPS on Low and 61.1 FPS on Medium, but dips below the threshold on High at 46.7 FPS and Ultra at 42.7 FPS. Moving to 2560x1440, all four presets clear 60 FPS, with a Low average of 169.1 FPS, Medium at 121.1 FPS, High at 83.6 FPS, and Ultra at 83.1 FPS. The 1920x1080 results are uniformly strong, showing 263.6 FPS on Low, 191.8 FPS on Medium, 135.1 FPS on High, and 128.8 FPS on Ultra.
Measured FPS Breakdown
The measured FPS data for this CPU-GPU pairing reveals a clear performance hierarchy tied to resolution and settings. At 3840x2160, the averages are 85.4 FPS on Low, 61.1 FPS on Medium, 46.7 FPS on High, and 42.7 FPS on Ultra. The gap between Medium and High is 14.4 FPS, while the drop from High to Ultra is a smaller 4 FPS, suggesting diminishing returns at the top end of the settings ladder. The 4K Ultra result of 42.7 FPS sits 17.4 FPS below the 60 FPS playable threshold, indicating a hard ceiling for maximum fidelity at this resolution.
At 2560x1440, the scaling is more forgiving. Low produces 169.1 FPS, Medium drops to 121.1 FPS, and both High and Ultra land close together at 83.6 FPS and 83.1 FPS respectively. The delta between Medium and High is 37.5 FPS, which is substantial, yet the near-identical High and Ultra scores suggest the GPU is becoming the limiting factor rather than the preset complexity. For 1920x1080, the numbers are 263.6 FPS on Low, 191.8 FPS on Medium, 135.1 FPS on High, and 128.8 FPS on Ultra. The jump from Low to Medium costs 71.8 FPS, while High to Ultra costs only 6.3 FPS, reinforcing a pattern where the most demanding preset tiers yield smaller absolute losses at lower resolutions.
No min or max FPS values are provided in the data, so the analysis relies solely on averages. The absence of frame-time variance data means the consistency of these averages cannot be assessed, but the raw numbers alone show a system that scales predictably with resolution and preset changes.
Best Settings per Resolution
For each resolution, the most demanding preset that remains at or above 60 FPS defines the best playable setting. At 3840x2160, the best settings is Medium, which delivers an average of 61.1 FPS. This is the only preset above the 60 FPS threshold at 4K aside from Low, which achieves 85.4 FPS but is less visually demanding. High at 46.7 FPS and Ultra at 42.7 FPS both fall short, so Medium is the optimal choice for balancing fidelity and playability at this resolution.
At 2560x1440, all four presets clear 60 FPS, so the best settings is Ultra with an average of 83.1 FPS. This allows for maximum graphical quality without sacrificing smoothness, as the margin above the threshold is 23.1 FPS. For 1920x1080, Ultra again is the best settings, producing 128.8 FPS, which is 68.8 FPS above the 60 FPS line. The data indicates that this combo has ample headroom at 1080p, making the highest preset the clear choice.
CPU and GPU Roles
Determining which component matters more for Pc Building Simulator requires examining the scaling between resolutions and presets. At 3840x2160, the average FPS drops from 85.4 on Low to 42.7 on Ultra, a decline of 42.7 FPS or roughly 50% of the Low value. This steep falloff at 4K points to the GPU bearing the primary load, as higher resolutions increase pixel throughput demands that stress the RTX 4060’s 8 GB GDDR6 memory and 128-bit bus. The Intel Core i5-12400F, with its 6 cores and 12 threads boosting to 4.40 GHz, likely has less influence at this resolution, since the graphics card becomes the bottleneck.
At 2560x1440, the pattern shifts. The spread from Low at 169.1 FPS to Ultra at 83.1 FPS is a 86 FPS difference, but the near-identical High and Ultra scores (83.6 vs 83.1) suggest the CPU is starting to play a larger role. When the GPU can handle the load at lower presets, the processor’s single-thread performance, evidenced by a 3dmark single-thread score of 909 and a Passmark single-thread score of 3481, could be capping frame rates. At 1920x1080, the CPU’s influence becomes more apparent: the 263.6 FPS Low result dwarfs the 128.8 FPS Ultra, and the smaller gaps between High and Ultra at this resolution hint that the i5-12400F is keeping pace with the GPU’s output.
The scaling across resolutions reinforces this. At Low settings, moving from 1080p to 1440p reduces FPS by 94.5 (263.6 to 169.1), and from 1440p to 4K by 83.7 (169.1 to 85.4). At Ultra, the drops are 45.7 (128.8 to 83.1) and 40.4 (83.1 to 42.7). The larger absolute losses at Low settings suggest the GPU is more saturated at higher resolutions, while the CPU’s role is more pronounced at lower resolutions and higher presets where frame rates are higher.
How This Combo Ranks
This specific combination of the Intel Core i5-12400F and NVIDIA GeForce RTX 4060 holds a combo rank of 1987 out of 3723 tested combos in Pc Building Simulator. This places it in the middle of the database, indicating that while it performs well in absolute terms, many other pairings deliver higher frame rates. The rank percentile is not explicitly given, but being near the midpoint of 3723 combos means roughly half the tested systems are faster. The CPU’s percentileVsAllCpus of 73 and the GPU’s percentileVsAllGpus of 61 provide context: the processor is above average relative to all CPUs, while the graphics card is slightly above the midpoint for GPUs. This asymmetry suggests the combo’s rank is constrained by the GPU’s more modest standing, as the RTX 4060’s 61st percentile is lower than the i5-12400F’s 73rd.
The combo’s measured FPS data aligns with this ranking. At 4K Ultra, 42.7 FPS is below the playable threshold, which is typical for mid-range GPUs on demanding settings. At 1440p and 1080p, the results are competitive but not exceptional, fitting a combo that ranks 1987th. The data implies that this system is a balanced mid-tier option, neither a high-end enthusiast build nor a low-end budget setup.
Similar Performance Alternatives
Examining the nearestRivals for the CPU and GPU provides insight into what other hardware would behave similarly. For the Intel Core i5-12400F, the closest rivals by average benchmark score are the AMD Ryzen 5 7535HS with a score of 19047 and a 0% deltaPct, the Intel Core 3 201E at 19056 with a -0.1% deltaPct, the Intel Core i5-1335U at 18982 with a 0.3% deltaPct, and the AMD EPYC 7773X at 18979 with a 0.3% deltaPct. These processors have nearly identical average scores, so a system with any of these CPUs paired with the RTX 4060 would likely produce similar FPS in Pc Building Simulator. The Ryzen 5 7535HS is a mobile chip, while the EPYC 7773X is a server part, but their benchmark scores indicate comparable raw performance for this game’s workload.
For the NVIDIA GeForce RTX 4060, the nearest rivals are the AMD Radeon HD 7790 with an avgScore of 17666 and a -0.2% deltaPct, the AMD Radeon 780M at 17588 with a 0.3% deltaPct, the AMD Radeon Pro 560 at 17551 with a 0.5% deltaPct, and the AMD Radeon Pro 460 at 17509 with a 0.7% deltaPct. These GPUs have average scores within a fraction of a percent of the RTX 4060’s 17639, meaning a swap to any of these would yield nearly indistinguishable frame rates. The Radeon HD 7790 is an older card, while the Radeon 780M is an integrated solution, but the benchmark data suggests they align closely in this game’s context.
FAQ
Q: Can this PC run Pc Building Simulator at 1080p?
A: Yes, at 1920x1080, all four presets clear the 60 FPS threshold. The lowest average is on Ultra at 128.8 FPS, and Low reaches 263.6 FPS.
Q: What is the best settings at 4K for this combo?
A: At 3840x2160, the best settings is Medium, which produces an average of 61.1 FPS. High at 46.7 FPS and Ultra at 42.7 FPS fall below the 60 FPS threshold.
Q: How does the RTX 4060 compare to its nearest GPU rivals?
A: The RTX 4060 has an average benchmark score of 17639, while the AMD Radeon HD 7790 scores 17666 (-0.2% deltaPct), the AMD Radeon 780M scores 17588 (0.3% deltaPct), the AMD Radeon Pro 560 scores 17551 (0.5% deltaPct), and the AMD Radeon Pro 460 scores 17509 (0.7% deltaPct).
Q: Is the i5-12400F a bottleneck for the RTX 4060?
A: The data does not directly measure bottlenecking, but the CPU’s percentileVsAllCpus of 73 is higher than the GPU’s percentileVsAllGpus of 61, suggesting the processor is less likely to limit performance than the graphics card is.
Q: What resolution gives the highest average FPS on Ultra?
A: At 1920x1080 on Ultra, the average is 128.8 FPS, which is the highest Ultra result across all three resolutions. At 2560x1440 Ultra it is 83.1 FPS, and at 3840x2160 Ultra it is 42.7 FPS.
Q: How many total combos are ranked in this game?
A: This combo ranks 1987 out of 3723 tested combos in Pc Building Simulator, placing it near the middle of the database.
The Verdict
This PC can run Pc Building Simulator, but the experience depends heavily on resolution and settings. At 3840x2160, the system is only playable on Low and Medium presets, with Medium providing the best balance at 61.1 FPS. High and Ultra at 46.7 FPS and 42.7 FPS respectively fail to meet the 60 FPS playable threshold. At 2560x1440, the verdict is fully positive: all four settings clear 60 FPS, with Ultra achieving 83.1 FPS as the best playable option. For 1920x1080, the combo excels, delivering 128.8 FPS on Ultra and a maximum of 263.6 FPS on Low, making it more than capable for smooth gameplay at any preset. In summary, this pairing is a solid mid-range choice that handles 1080p and 1440p with ease, while 4K gaming is limited to lower settings to stay above 60 FPS.