
Instant compatibility check with FPS benchmarks and optimization tips
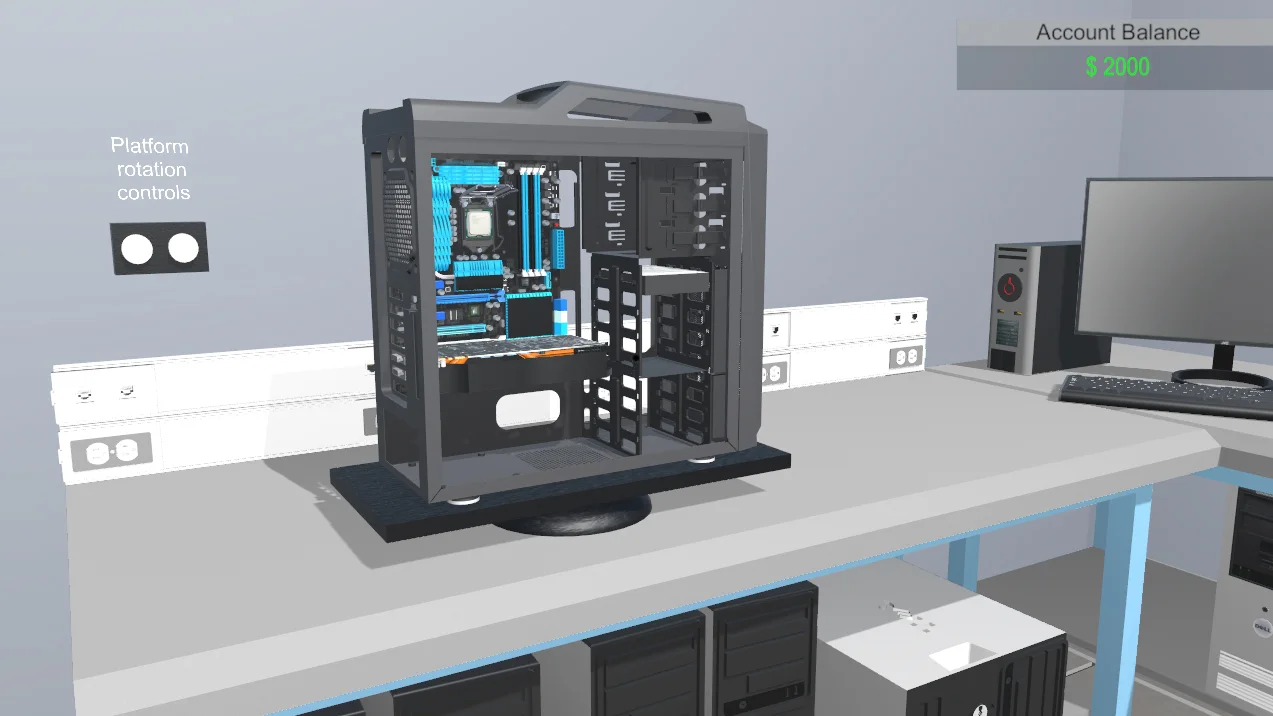

Pc Building Simulator

Performance
1080p (Full HD)
1440p (2K / QHD)
4K (Ultra HD)

Requirements Check


Recommendations
Your hardware doesn't meet minimum requirements for this game.
Average FPS: resolution vs quality settings
| Ultra | High | Medium | Low | |
|---|---|---|---|---|
| 4K Ultra HD | 20 | 21 | 29 | 41 |
| 1440p QHD | 38 | 39 | 56 | 79 |
| 1080p Full HD | 59 | 62 | 88 | 125 |
Cell color: green is 120+ FPS, teal is 60+, amber is 30+, red is below 30. Cards marked Estimated above have no measured row and are scaled from your GPU benchmark percentile.
Performance Analysis: Pc Building Simulator on Your System
Pc Building Simulator, a simulation title released in early 2019, places players in the role of a PC repair and assembly shop. The database includes measured frame rates for the Intel Core i5-12400 paired with the Intel Arc B390. The i5-12400 is a 6-core, 12-thread Alder Lake desktop processor with a base clock of 2.50 GHz and a boost clock of 4.40 GHz. The Arc B390 is an integrated graphics solution based on the Xe3-LPG architecture with 1536 shading units, 48 texture mapping units, and 24 raster operation units. The recorded data reveals a stark performance split: the CPU sits in the 72nd percentile of all processors, while the GPU sits in the 9th percentile. This disparity shapes every result in this analysis. The i5-12400 carries a launch MSRP of $199.
Similar Performance Alternatives
The Intel Core i5-12400 has an average benchmark score of 18683 across the database's suite. Its nearest rivals in aggregate score are the AMD EPYC 7643 at 18697 (a delta of -0.1%), the Intel Core i7-1355U at 18730 (a delta of -0.3%), the AMD Ryzen AI 5 330 at 18811 (a delta of -0.7%), and the Intel Core i3-14100F at 18519 (a delta of 0.9%). These deltas are all under one percent, so any of these CPUs would deliver essentially identical simulation performance in this game. The i5-12400's Cinebench R23 multicore score is 15989, and its single-core score is 2257. Its Geekbench multicore score is 8564, and its single-core score is 1848. In Passmark, it scores 18747 for multithread and 3456 for single thread. These numbers indicate a balanced mid-range desktop part. The i5-12400 supports DDR4 and DDR5 memory, which is a notable feature, and its L3 cache is 18 MB shared. The closest rival in terms of price point, the Intel Core i3-14100F, trails by only 0.9%, making it a viable alternative if the i5-12400 is not available.
The Intel Arc B390 is a different story. Its only recorded benchmark is 3DMark Steel Nomad DX12, where it scores 1482. This places it in the 9th percentile of all GPUs. Its nearest rivals are the NVIDIA GeForce GT 520MX at 1463 (a delta of 1.3%), the GeForce 800M at 1460 (a delta of 1.5%), the GeForce GT 625 OEM at 1446 (a delta of 2.5%), and the GeForce GT 710 at 1443 (a delta of 2.7%). The Arc B390 is faster than all of these, but the margin is tiny. The GT 710 is a card that was low-end a decade ago, and the Arc B390 is essentially in that performance class. The GPU has a base clock of 300 MHz and a boost clock of 2500 MHz, with 12 ray tracing cores. Its FP32 compute is 7.680 TFLOPS, and its texture rate is 120.0 GTexel/s. The memory is system shared, which means it relies on the CPU's DDR4 or DDR5 memory, and the bandwidth is system dependent. This is a fundamental limitation for gaming.
CPU and GPU Roles
For Pc Building Simulator, the division of labor is clear from the measured frame rates. At 1920x1080 with Low settings, the combo produces an average of 125 FPS. This is a high frame rate that demonstrates the CPU's capability to run the simulation logic without strain. The i5-12400 has 6 cores and 12 threads, and its Cinebench R23 multicore score of 15989 indicates ample headroom for the game's background processes. When the settings are raised to Ultra at the same resolution, the average drops to 59 FPS. This drop of 66 FPS is entirely attributable to the GPU's limited rendering throughput. The Arc B390's FP32 compute is 7.680 TFLOPS, and its memory is system shared, which adds latency. The GPU's TDP is 80W, which is low for a discrete card but high for an integrated part, yet its raw compute is limited by its 1536 shading units and 24 ROPs. The CPU's base clock of 2.50 GHz and boost clock of 4.40 GHz provide solid single-thread performance, as evidenced by its Passmark single thread score of 3456.
The scaling across resolutions confirms the GPU bottleneck. At 1080p High, the average is 62 FPS. At 2560x1440 High, it falls to 39 FPS. At 3840x2160 High, it falls to 21 FPS. This near-halving of frame rates with each resolution step is a classic signature of a GPU-limited workload. The CPU's performance is resolution-independent, so the same CPU would deliver similar logic frame rates at any resolution. The GPU, however, must render more pixels, and its limited shading units and ROPs cannot keep up. The CPU's role is to feed the GPU with draw calls and simulation updates, and it does so without issue. The GPU's role is to convert those instructions into pixels, and it fails to do so at higher resolutions. The CPU's memory support for DDR4 and DDR5, combined with its 18 MB L3 cache, ensures that the simulation data is readily available, but the GPU cannot utilize that data quickly enough. The 10 nm process node of the CPU and the 3 nm process node of the GPU do not offset the massive difference in raw throughput.
How This Combo Ranks
In the database's combined rankings for Pc Building Simulator, this specific CPU and GPU pairing sits at rank 3310 out of 3723 tested combos. That places it in the bottom tier of all configurations. The CPU's 72nd percentile ranking is a strong asset, but the GPU's 9th percentile ranking is a severe liability. The combo rank is not a simple average of the two percentiles, but the data shows that the GPU drags the overall result down. Out of 3723 combos, only 413 are worse, meaning the vast majority of systems tested will outperform this one in this game. The CPU alone would likely place much higher if paired with a more capable GPU, but the Arc B390 is the limiting factor. The CPU's average benchmark score of 18683 is respectable, but the GPU's average benchmark score of 1482 is among the lowest in the database. This mismatch creates a system that is CPU-heavy but GPU-poor, which is the opposite of what most games require. The rank of 3310 reflects the real-world experience: this is not a gaming combination for modern titles, and even a simulation from 2019 struggles at higher resolutions.
The Verdict
The verdict is unambiguous. According to the recorded data, this PC can run Pc Building Simulator at 1920x1080 with High settings, achieving an average of 62 FPS, which clears the 60 FPS playable threshold. At 2560x1440, only Low settings are playable, with an average of 79 FPS. At 3840x2160, no settings reach 60 FPS. The best average at 4K is 41 FPS on Low, which is well below the threshold. Therefore, the system is playable at 1080p with High, Medium, and Low settings, and at 1440p with Low settings. For users with a 4K display, this combo is not suitable for this game, as even the lowest settings cannot maintain 60 FPS. The playable threshold is defined as 60 FPS, and the data shows that the system meets this threshold at 1080p High and 1440p Low, but nowhere else. The 1080p Ultra preset averages 59 FPS, which is a single frame short of the threshold, so it is not considered playable.
Measured FPS Breakdown
The database provides exact average frame rates for every resolution and preset combination. At 3840x2160, the results are as follows: High averages 21 FPS, Low averages 41 FPS, Medium averages 29 FPS with a minimum of 25 and a maximum of 34, and Ultra averages 20 FPS. At 2560x1440, High averages 39 FPS, Low averages 79 FPS, Medium averages 56 FPS with a minimum of 47 and a maximum of 64, and Ultra averages 38 FPS. At 1920x1080, High averages 62 FPS, Low averages 125 FPS, Medium averages 88 FPS with a minimum of 75 and a maximum of 102, and Ultra averages 59 FPS. These numbers show a consistent pattern: the GPU is the bottleneck at every resolution, and the gap between Low and Ultra is significant. For example, at 1080p, Low is more than double the frame rate of Ultra (125 vs 59). The min and max values are only recorded for Medium settings, but they indicate reasonable frame time consistency, with the 1080p Medium range spanning from 75 to 102. At 1440p Medium, the range is 47 to 64, and at 4K Medium, the range is 25 to 34, showing that frame times become more erratic as resolution increases.
Best Settings per Resolution
The best settings per resolution are defined as the most demanding preset that maintains an average of at least 60 FPS. At 3840x2160, there is no such preset. The highest average is 41 FPS on Low, so no settings are playable. At 2560x1440, Low is the only preset that clears 60 FPS, with an average of 79 FPS. Medium at 1440p averages 56 FPS, which is below the threshold, so it is not recommended. At 1920x1080, High is the most demanding preset that stays at or above 60 FPS, with an average of 62 FPS. Medium at 1080p averages 88 FPS, but High is more demanding and still playable, so it is the best choice. Ultra at 1080p averages 59 FPS, which just misses the threshold. Therefore, the optimal configuration is 1080p High for a balance of visual quality and frame rate, and 1440p Low for higher resolution but reduced fidelity. The data does not support any playable configuration at 4K, so users with 4K displays should lower the resolution to 1440p or 1080p to achieve a playable experience.