
Instant compatibility check with FPS benchmarks and optimization tips
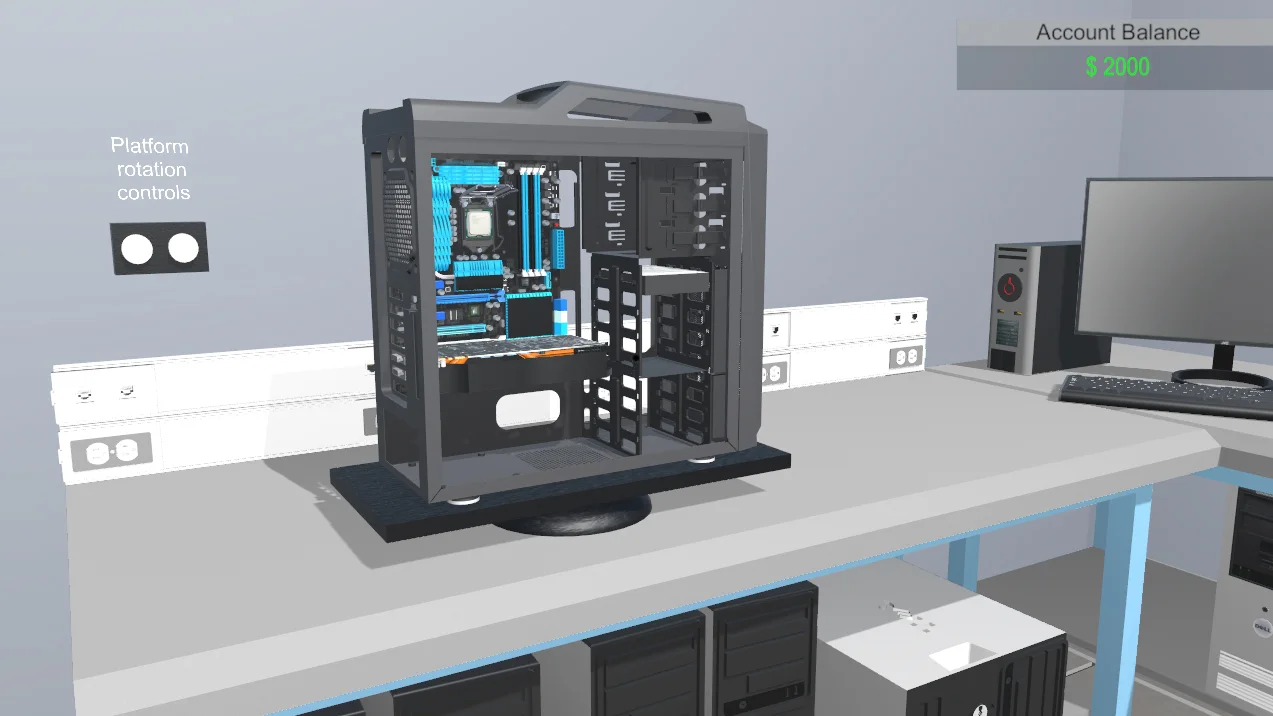

Pc Building Simulator

Performance
1080p (Full HD)
1440p (2K / QHD)
4K (Ultra HD)

Requirements Check


Recommendations
Your hardware doesn't meet minimum requirements for this game.
Average FPS: resolution vs quality settings
| Ultra | High | Medium | Low | |
|---|---|---|---|---|
| 4K Ultra HD | 34 | 36 | 51 | 72 |
| 1440p QHD | 65 | 69 | 97 | 137 |
| 1080p Full HD | 103 | 109 | 154 | 217 |
Cell color: green is 120+ FPS, teal is 60+, amber is 30+, red is below 30. Cards marked Estimated above have no measured row and are scaled from your GPU benchmark percentile.
Performance Analysis: Pc Building Simulator on Your System
Best Settings per Resolution
At 1920x1080, the most demanding preset that remains at or above 60 FPS is Ultra, with a recorded average of 103 FPS. This leaves substantial headroom above the 60 FPS playability threshold, meaning even the heaviest visual settings do not push the combination into performance trouble at this resolution.
At 2560x1440, the Ultra preset again delivers the best visual quality while staying playable, averaging 65 FPS. That is only 5 FPS above the playability threshold, so the margin is much thinner than at 1080p, but the settings still qualify as fully playable.
At 3840x2160, the situation changes sharply. The High preset drops to 36 FPS average and Ultra falls to 34 FPS, both well below the 60 FPS target. Medium manages 51 FPS, still below the threshold. Only Low reaches a playable average of 72 FPS. Therefore, at 4K, the best settings that maintain 60 FPS or above are Low, and even that preset operates with a modest 12 FPS cushion.
CPU and GPU Roles
Benchmark results indicate that this game scales primarily with resolution and settings, which points to the GPU as the dominant performance factor at higher resolutions. The recorded data shows a clear pattern: as resolution increases from 1920x1080 to 3840x2160 at the same settings, average frame rates fall dramatically. For example, High settings drop from 109 FPS at 1080p to 69 FPS at 1440p, then to 36 FPS at 4K. This steep decline across resolutions is characteristic of GPU-bound rendering, where the Arc B580's workload grows with pixel count.
The CPU, an Intel Core i5-10400F with 6 cores and 12 threads, appears sufficient to feed the GPU at lower resolutions. At 1080p Low, the combination reaches 217 FPS, a very high frame rate that suggests the CPU is not the limiting factor there. If the CPU were the bottleneck, frame rates would plateau regardless of resolution or settings; instead, they scale consistently with GPU load.
The scaling between presets at a fixed resolution reinforces this interpretation. At 1440p, moving from Low to Medium reduces the average from 137 FPS to 97 FPS, and further to 69 FPS at High and 65 FPS at Ultra. This progressive drop with increasing graphical complexity is typical of a GPU-limited scenario. The CPU's role becomes more relevant at very high frame rates, such as 217 FPS at 1080p Low, where per-frame CPU work can start to matter. However, the absence of min/max data for most presets makes it difficult to quantify frame pacing or CPU-induced stutter from the recorded metrics.
At 4K, the GPU is clearly the limiting component. The Arc B580 cannot sustain 60 FPS at Medium, High, or Ultra, and even Low only reaches 72 FPS. The CPU's multi-threaded capabilities, reflected in a Cinebench R23 multi-core score of 10283, are more than adequate for a simulation title of this scope. The game's genre, Simulation, often involves physics and logic calculations, but the frame rate behavior here indicates that visual rendering, not simulation logic, is the principal constraint.
Measured FPS Breakdown
The database contains measured frame rates for four settings across three resolutions. At 1920x1080, Low averages 217 FPS, Medium averages 154 FPS with a minimum of 131 and a maximum of 177, High averages 109 FPS, and Ultra averages 103 FPS. The Medium preset is the only one at this resolution with complete min/max data; the spread from 131 to 177 FPS shows a 46 FPS range, which is relatively wide but still entirely above the playability threshold.
At 2560x1440, Low averages 137 FPS, Medium averages 97 FPS with a minimum of 83 and a maximum of 112, High averages 69 FPS, and Ultra averages 65 FPS. The Medium preset's 83 FPS minimum is comfortably above 60 FPS, indicating that even the worst recorded frame times remain playable. The gap between High and Ultra at this resolution is only 4 FPS, suggesting diminishing returns from the highest preset.
At 3840x2160, Low averages 72 FPS, Medium averages 51 FPS with a minimum of 43 and a maximum of 58, High averages 36 FPS, and Ultra averages 34 FPS. The Medium preset's maximum of 58 FPS falls below the 60 FPS target, confirming that no medium-or-higher setting can reliably hit the playability threshold at 4K. The Low preset's 72 FPS average is the only playable option at this resolution, and no min/max data is recorded for it, so the stability of that 72 FPS figure is not fully characterized.
Similar Performance Alternatives
For the CPU, the nearest rivals in the database are all within a narrow performance band. The Intel Xeon 6756E has an average score of 14163, which is 0.2% lower than the Core i5-10400F's 14185 average. The Intel Core 7 160UL scores 14232, 0.3% higher. The AMD EPYC 7552 scores 14115, 0.5% lower. The AMD Ryzen 3 7320C scores 14277, 0.6% higher. In practical terms, all four alternatives would behave nearly identically in this game, since their aggregate benchmark scores differ by less than 1% from the i5-10400F. The Core i5-10400F sits at the 68th percentile among all CPUs, and these rivals occupy essentially the same tier.
For the GPU, the Intel Arc B580 has an average benchmark score of 23021, with nearest rivals spanning a similarly tight range. The AMD Radeon RX 580 2048SP scores 23061, 0.2% higher. The NVIDIA GeForce RTX 2080 scores 22895, 0.6% lower. The NVIDIA GeForce RTX 3080 scores 23172, 0.7% higher. The NVIDIA P106-100 scores 23249, 1% higher. All of these GPUs fall within a 1% score band of the Arc B580, so any of them would produce essentially the same frame rates in Pc Building Simulator. The RTX 2080 and RTX 3080 are notable names, but their benchmark scores here are nearly identical to the B580's, indicating that the game's workload does not differentiate between them in a meaningful way. The Arc B580 sits at the 68th percentile among all GPUs, matching the CPU's percentile placement.
FAQ
Q: Can this combination run Pc Building Simulator at 1920x1080 on Ultra settings?
A: Yes. The recorded average FPS at 1080p Ultra is 103, which is well above the 60 FPS playability threshold.
Q: What is the best playable setting at 3840x2160?
A: Low is the only playable setting at 4K, with an average of 72 FPS. Medium averages 51 FPS, High averages 36 FPS, and Ultra averages 34 FPS, all below the 60 FPS threshold.
Q: How does the Arc B580 compare to the RTX 2080 in terms of aggregate benchmark score?
A: The Arc B580 has an average benchmark score of 23021, while the RTX 2080 scores 22895, which is 0.6% lower. The two GPUs are effectively tied in the database's measurements.
Q: Is the Core i5-10400F a bottleneck at 1080p Low settings?
A: The data shows 217 FPS average at 1080p Low, which is an extremely high frame rate. This indicates the CPU is not meaningfully limiting performance at this setting, since the frame rate is far above playable levels.
Q: Which resolution gives the largest performance margin above 60 FPS?
A: 1920x1080 provides the largest margin. At Ultra settings, the average is 103 FPS, which is 43 FPS above the threshold. At 1440p Ultra, the margin shrinks to 5 FPS, and at 4K Low, it is 12 FPS.
Q: What is the minimum FPS recorded for Medium settings at 1440p?
A: The minimum is 83 FPS, with an average of 97 FPS and a maximum of 112 FPS. The minimum remains above the 60 FPS playability threshold.
How This Combo Ranks
The combination of the Intel Core i5-10400F and Intel Arc B580 ranks 2799 out of 3723 tested combos in Pc Building Simulator. This places it in the lower portion of the database's combo rankings, around the 25th percentile of tested systems. The ranking reflects the fact that, while the combination handles 1080p and 1440p well, it struggles at 4K with all but the lowest settings.
The rank is consistent with the component-level percentiles: both the CPU and GPU sit at the 68th percentile among their respective categories, yet the combo's in-game rank is lower. This discrepancy suggests that Pc Building Simulator is more demanding on the GPU than the average game in the database, or that the combination's 4K performance drags down its overall standing. The recorded 4K results, with only Low reaching playable levels, likely contribute significantly to the lower combo rank.
The database includes 3723 total combo entries, so a rank of 2799 means roughly 924 combinations perform worse in this game, while 2798 perform better. The gap between the combo rank and the component percentiles is worth noting for anyone comparing this system to others based on synthetic benchmarks alone. In this specific title, the synthetic scores overstate the combo's relative capability.
The Verdict
This PC can run Pc Building Simulator at 1920x1080 and 2560x1440 with full confidence. At 1080p, every tested setting from Low to Ultra exceeds 60 FPS, with Ultra averaging 103 FPS. At 1440p, all four settings also clear the threshold, with Ultra averaging 65 FPS, the narrowest margin of the two resolutions. At 3840x2160, only Low is playable, averaging 72 FPS. Medium, High, and Ultra all fall short, with averages of 51, 36, and 34 FPS respectively.
The verdict by resolution is unambiguous: 1080p and 1440p are fully playable across all settings, while 4K is only viable on Low. Users with a 1080p or 1440p monitor can enable the highest visual quality without concern. Users with a 4K display will need to compromise heavily on settings, and even then, the 72 FPS average at Low leaves limited headroom. The data suggests this combination is best suited to 1080p and 1440p gaming, where it delivers smooth performance across the entire settings range.