
Instant compatibility check with FPS benchmarks and optimization tips
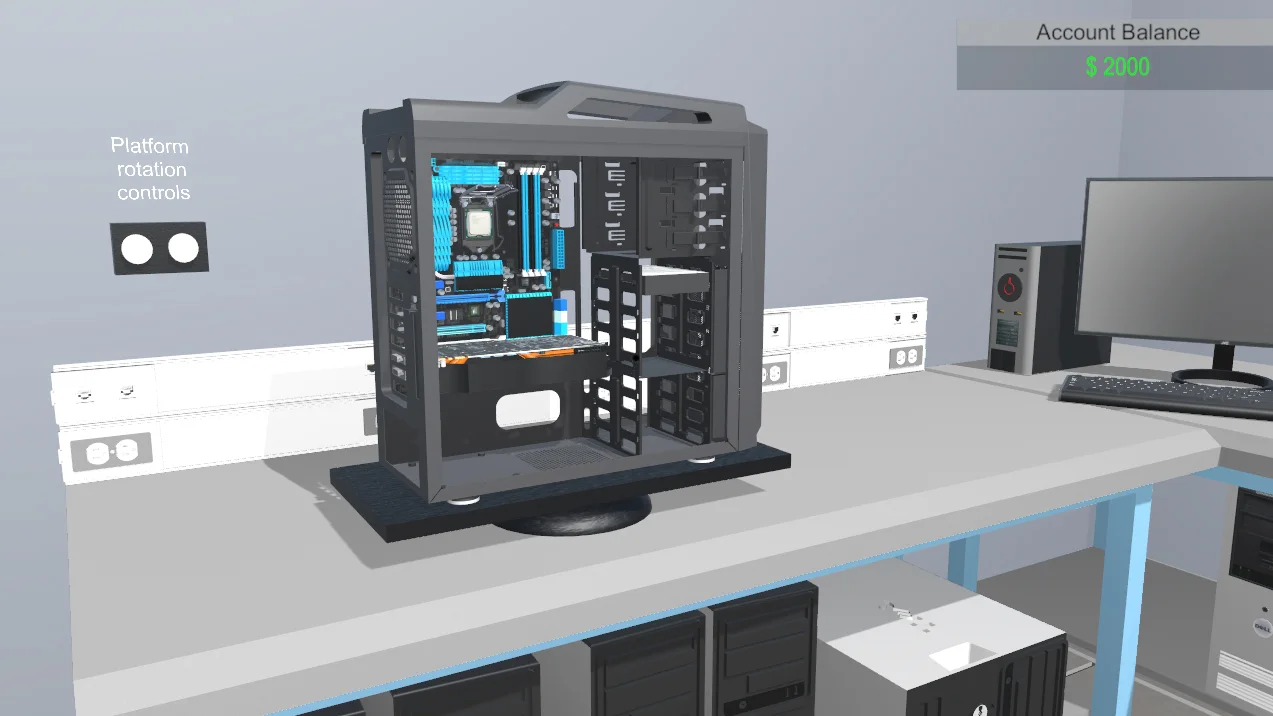

Pc Building Simulator

Performance
1080p (Full HD)
1440p (2K / QHD)
4K (Ultra HD)

Requirements Check


Recommendations
Your hardware doesn't meet minimum requirements for this game.

Your GPU supports ray tracing.
Average FPS: resolution vs quality settings
| Ultra | High | Medium | Low | |
|---|---|---|---|---|
| 4K Ultra HD | 32 | 32 | 51 | 70 |
| 1440p QHD | 61 | 64 | 92 | 131 |
| 1080p Full HD | 97 | 102 | 148 | 206 |
Cell color: green is 120+ FPS, teal is 60+, amber is 30+, red is below 30. Cards marked Estimated above have no measured row and are scaled from your GPU benchmark percentile.
Performance Analysis: Pc Building Simulator on Your System
Measured FPS Breakdown
The recorded data for Pc Building Simulator shows a wide performance range across the three tested resolutions, with the Intel Core i3-12100F and NVIDIA GeForce RTX 2060 combination delivering playable frame rates in most configurations. The benchmark results are measured averages, with no minimum or maximum frame time data recorded in the database.
At 1920x1080, the system performs comfortably above the 60 FPS playable threshold in every preset. The Low preset produces an average of 206 FPS, which is the highest recorded figure across all resolutions and settings. Medium settings yield 148.1 FPS on average. High settings drop to 101.5 FPS, while Ultra settings still maintain a strong 96.8 FPS average. The scaling pattern from Low to Ultra shows a reduction of roughly 53 percent from the lowest to the highest preset, but every configuration remains far above the playable threshold.
Moving to 2560x1440, the performance profile shifts downward but remains playable across all presets. Low settings average 130.6 FPS, Medium averages 92.1 FPS, and High averages 63.8 FPS. The Ultra preset produces 61.1 FPS on average, which clears the 60 FPS threshold by a slim margin. The gap between Low and Ultra at this resolution is about 69.5 FPS, indicating that the GPU handles the increased pixel count with moderate impact on frame rates.
At 3840x2160, the picture changes substantially. The Low preset averages 70 FPS, which is the only playable setting at this resolution. Medium settings fall to 51.2 FPS, below the playable threshold. High settings average 31.5 FPS, and Ultra settings average 32.1 FPS. The delta between Low and Ultra at 4K is approximately 37.9 FPS, showing that the render load at this resolution heavily taxes the GPU. Notably, the High preset at 4K (31.5 FPS) performs slightly worse than Ultra (32.1 FPS), a minor anomaly in the recorded data that may reflect scene complexity variations rather than a consistent scaling pattern.
Across all resolutions, the frame rate drop from 1080p to 1440p averages roughly 35 to 40 percent depending on the preset, while the drop from 1440p to 4K is much steeper, often exceeding 50 percent. This indicates that the RTX 2060's 6 GB GDDR6 memory and 336.0 GB/s bandwidth become limiting factors as pixel count rises.
FAQ
Q: Can this PC run Pc Building Simulator at 1080p with Ultra settings?
A: Yes. The recorded average FPS at 1920x1080 with Ultra settings is 96.8, which is well above the 60 FPS playable threshold.
Q: What is the highest playable preset at 4K resolution?
A: At 3840x2160, only the Low preset clears 60 FPS, with an average of 70 FPS. Medium, High, and Ultra all fall below the threshold at 51.2, 31.5, and 32.1 FPS respectively.
Q: How does the RTX 2060 compare to its nearest rivals in this game?
A: The database lists the RTX 2060 with an average benchmark score of 15290. Its nearest rival is the NVIDIA GeForce GTX 580 at 15283 (0 percent delta), followed by the AMD Radeon 680M at 15270 (0.1 percent delta), the NVIDIA GeForce RTX 3050 OEM at 15199 (0.6 percent delta), and the AMD Radeon RX 7600 at 15171 (0.8 percent delta). All of these GPUs sit within 1 percent of each other in aggregate benchmarks, indicating similar overall throughput.
Q: Does the CPU bottleneck the GPU in this game?
A: The Intel Core i3-12100F sits at the 68th percentile among all CPUs with an average benchmark score of 13494. Its nearest rivals include the Intel Core 3 N355 at 13492 (0 percent delta), the Intel Core i5-9500 at 13452 (0.3 percent delta), the Intel Core 5 120UL at 13594 (-0.7 percent delta), and the Intel Core i7-1250U at 13351 (1.1 percent delta). Given the large FPS swings between presets at each resolution, the GPU appears to be the primary performance driver, though the CPU's single-thread score of 893 in 3dmark single-thread testing suggests adequate headroom for simulation logic.
Q: What is the best settings preset at 1440p?
A: The Ultra preset at 2560x1440 averages 61.1 FPS, which is the highest visual quality that remains playable. All four presets (Low, Medium, High, Ultra) clear 60 FPS at this resolution.
Q: Is the system ranked highly for this game?
A: The combination ranks 2891 out of 3723 tested combinations in the database. This places it in the lower-middle portion of the rankings, which is consistent with the fact that only one preset is playable at 4K while all presets are playable at lower resolutions.
Best Settings per Resolution
The database identifies the most demanding preset that remains at or above 60 FPS for each resolution. These are the settings that maximize visual quality while preserving playability.
At 1920x1080, the Ultra preset is the best choice, producing an average of 96.8 FPS. This is the highest quality setting available and it clears the 60 FPS threshold by a substantial margin. There is no need to compromise on visual fidelity at this resolution.
At 2560x1440, the Ultra preset also qualifies as the best setting, with an average of 61.1 FPS. This is a narrow margin above the playable threshold, but it is sufficient. Users who prefer additional headroom could step down to High at 63.8 FPS, but the data shows that Ultra remains viable.
At 3840x2160, only the Low preset achieves playable performance, averaging 70 FPS. Medium falls to 51.2 FPS, which is below the 60 FPS threshold, so the best playable setting is Low. The gap between Low and Medium at this resolution is 18.8 FPS, indicating that the step up in quality carries a significant performance cost.
Similar Performance Alternatives
The nearest rivals in the database provide context for how other hardware would behave in this game. These comparisons are based on aggregate benchmark scores, not direct game measurements, but they indicate which components would produce similar frame rates.
For the CPU, the Intel Core i3-12100F has an average benchmark score of 13494. The Intel Core 3 N355 scores 13492, a 0 percent delta, meaning it would perform almost identically in CPU-bound scenarios. The Intel Core i5-9500 scores 13452, 0.3 percent lower, placing it within the same performance tier. The Intel Core 5 120UL scores 13594, which is 0.7 percent higher, while the Intel Core i7-1250U scores 13351, 1.1 percent lower. All of these processors sit within roughly 1 percent of the i3-12100F, so users swapping between them would see negligible differences in this game.
For the GPU, the NVIDIA GeForce RTX 2060 has an average benchmark score of 15290. The NVIDIA GeForce GTX 580 matches closely at 15283 (0 percent delta). The AMD Radeon 680M scores 15270 (0.1 percent delta), and the NVIDIA GeForce RTX 3050 OEM scores 15199 (0.6 percent delta). The AMD Radeon RX 7600 scores 15171 (0.8 percent delta). These GPUs are all within a narrow band of the RTX 2060, so any of them would deliver comparable frame rates in Pc Building Simulator.
Notably, the RTX 2060 sits at the 58th percentile among all GPUs, while the CPU sits at the 68th percentile. This suggests that the GPU is the more limiting component in this pairing, and systems with a similarly ranked CPU but a stronger GPU would see larger gains than systems with a stronger CPU and the same GPU.
CPU and GPU Roles
The scaling between resolutions and presets reveals which component matters more for this game. The data shows a clear pattern: the GPU dominates performance at higher resolutions and higher presets, while the CPU's role is less prominent.
At 1920x1080, the frame rate scales from 206 FPS at Low to 96.8 FPS at Ultra, a reduction of 109.2 FPS. This large swing indicates that the GPU is heavily tasked even at 1080p when settings increase. The CPU's single-thread performance, measured at 893 in 3dmark single-thread and 1674 in Cinebench R23 single-core, is sufficient to keep up with the GPU's output at this resolution.
At 2560x1440, the frame rates drop further: 130.6 FPS at Low, 92.1 FPS at Medium, 63.8 FPS at High, and 61.1 FPS at Ultra. The delta from Low to Ultra is 69.5 FPS, a smaller absolute reduction than at 1080p but still a significant percentage drop. This pattern is consistent with GPU-bound behavior.
At 3840x2160, the GPU becomes the clear bottleneck. The Low preset averages 70 FPS, but Medium drops to 51.2 FPS and High/Ultra fall to 31.5 and 32.1 FPS respectively. The massive performance collapse between Low and Medium at 4K indicates that the RTX 2060's 6 GB VRAM and 192-bit memory bus are overwhelmed when texture and shading complexity increases at this pixel count. The CPU's workload does not change with resolution, so the fact that frame rates fall so steeply at 4K points squarely at the GPU.
Comparing the 1080p Low result (206 FPS) to the 4K Low result (70 FPS) shows a 136 FPS reduction purely from pixel count. This is a 66 percent loss, which is far larger than the CPU's contribution would suggest. The CPU's multi-thread scores, including a Cinebench R23 multi-core score of 11860 and a Passmark multithread score of 14015, indicate it has ample compute headroom.
In summary, the CPU is rarely the limiting factor in this game. The GPU dictates performance at every resolution, and its limitations become pronounced at 4K with medium or higher presets.
The Verdict
This system can run Pc Building Simulator, but the playable range depends heavily on resolution and settings. The verdict by resolution is clear.
At 1920x1080, the system runs the game with all presets comfortably above 60 FPS. The Ultra preset averages 96.8 FPS, making this resolution the sweet spot for full visual quality with substantial headroom.
At 2560x1440, the system remains playable at every preset, including Ultra at 61.1 FPS. This is a usable configuration for high-refresh displays, though the margin above 60 FPS is thin at the highest settings. Users who prefer stability over visual extremes can choose High at 63.8 FPS.
At 3840x2160, the system only clears 60 FPS with the Low preset, which averages 70 FPS. Medium, High, and Ultra all fall below the playable threshold, with High (31.5 FPS) and Ultra (32.1 FPS) producing particularly low results. 4K gaming with this hardware requires significant setting compromises.
The overall ranking of 2891 out of 3723 combinations places this system in the lower-middle tier for Pc Building Simulator. It is a capable 1080p and 1440p machine for this title, but 4K users should stick to Low settings or consider a stronger GPU. The RTX 2060's performance profile, with a 58th percentile ranking among GPUs, is the deciding factor in this pairing.