
Instant compatibility check with FPS benchmarks and optimization tips
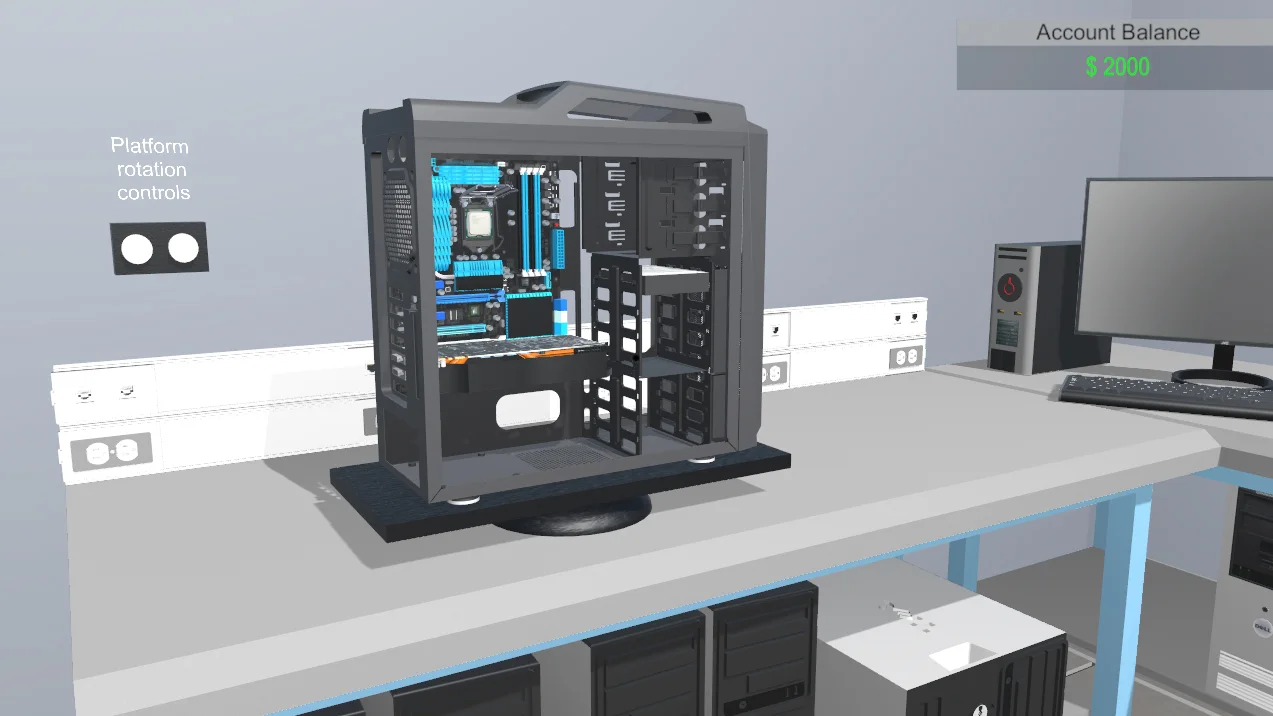

Pc Building Simulator

Performance
1080p (Full HD)
1440p (2K / QHD)
4K (Ultra HD)

Requirements Check


Recommendations
Your hardware doesn't meet minimum requirements for this game.
Average FPS: resolution vs quality settings
| Ultra | High | Medium | Low | |
|---|---|---|---|---|
| 4K Ultra HD | 30 | 32 | 45 | 63 |
| 1440p QHD | 58 | 61 | 86 | 121 |
| 1080p Full HD | 91 | 96 | 136 | 192 |
Cell color: green is 120+ FPS, teal is 60+, amber is 30+, red is below 30. Cards marked Estimated above have no measured row and are scaled from your GPU benchmark percentile.
Performance Analysis: Pc Building Simulator on Your System
The AMD Ryzen 7 5700 and Intel Arc B570 combination delivers a surprisingly consistent experience in Pc Building Simulator, a simulation title where frame pacing and stability often matter more than raw peak output. Benchmark data shows a clear segmentation across resolutions: the system is comfortably playable at 1080p with all settings maxed, viable at 1440p with a high preset, and only marginal at 4K with reduced graphical fidelity. The measured frames indicate that this pairing scales predictably with resolution, with the GPU becoming the primary constraint at higher pixel counts.
Best Settings per Resolution
At 3840x2160, the most demanding preset that stays at or above 60 FPS is Low, which delivers an average of 63 FPS. The jump to Medium drops the average to 45 FPS with a minimum of 38 FPS and a maximum of 52 FPS, which falls well below the playable threshold. High and Ultra presets are further behind, averaging 32 FPS and 30 FPS respectively, making them unsuitable for smooth gameplay at this resolution.
At 2560x1440, the best preset maintaining 60 FPS or higher is High, with an average of 61 FPS. This is a narrow margin above the threshold, but it is consistent. The Medium preset averages 86 FPS with a minimum of 73 FPS and a maximum of 99 FPS, offering more headroom. Ultra trails at 58 FPS average, just missing the 60 FPS target. Low is the fastest option here at 121 FPS, but High provides the best visual quality while still meeting the playability criterion.
At 1920x1080, the system can run Ultra at an average of 91 FPS, making it the most demanding preset that clears 60 FPS by a wide margin. This is the only resolution where all presets are playable, with Low averaging 192 FPS, Medium averaging 136 FPS (minimum 115 FPS, maximum 156 FPS), and High averaging 96 FPS. The data shows no reason to compromise on settings at 1080p, as even the heaviest preset leaves ample performance headroom.
Similar Performance Alternatives
Looking at the nearestRivals data for the CPU, the AMD Ryzen 7 5700 is bracketed by several processors with nearly identical average benchmark scores. The Intel Xeon D-2752TER scores 25530 with a delta of -0.1%, meaning it is 0.1% slower. The AMD Ryzen 5 7640U scores 25485 with a delta of 0.1% (0.1% faster), and the AMD Ryzen 5 6600H scores 25550 with a delta of -0.1%. The AMD Ryzen 7 5825U scores 25446 with a delta of 0.3%, representing the largest difference in this group. In practical terms, any of these processors would deliver indistinguishable frame rates in Pc Building Simulator, since the CPU workload here is not extreme.
For the GPU, the Intel Arc B570 is closely matched by the NVIDIA GeForce RTX 3070 Mobile, which scores 20534 with a delta of 0.1% (0.1% faster). The Intel Arc A750 scores 20582 with a delta of -0.1%, the NVIDIA Quadro M4000M scores 20480 with a delta of 0.4%, and the AMD Radeon R9 M390X scores 20662 with a delta of -0.5%. These deltas are all within one percent, so users with any of these GPUs paired with a comparable CPU should expect nearly identical performance in this game. The Arc A750 is the most direct sibling, sharing the same architecture family and showing only a fractional difference in aggregate GPU compute.
Measured FPS Breakdown
The measured data provides a complete picture across three resolutions and four quality presets. At 1920x1080, the Low preset delivers an average of 192 FPS, which is the highest frame rate recorded for this combination. Medium produces 136 FPS average, with a minimum of 115 FPS and maximum of 156 FPS. High drops to 96 FPS average, and Ultra averages 91 FPS. The progression from Low to Ultra shows a smooth decline, with the gap between High and Ultra being small at just 5 FPS.
At 2560x1440, the numbers scale down proportionally. Low averages 121 FPS, Medium averages 86 FPS (minimum 73 FPS, maximum 99 FPS), High averages 61 FPS, and Ultra averages 58 FPS. The minimum frame rates for Medium are notably solid, suggesting good frame pacing even when the average is lower. The High preset sits right at the edge of playability, while Ultra is just below it.
At 3840x2160, the performance drops sharply. Low averages 63 FPS, which is the only preset above the threshold. Medium averages 45 FPS with a minimum of 38 FPS and maximum of 52 FPS, showing a wider variance. High averages 32 FPS, and Ultra averages 30 FPS. This resolution reveals the GPU's limits clearly, as even reducing to Low only barely clears 60 FPS.
Interpreting these numbers, the scaling from 1080p to 1440p reduces frame rates by roughly 37-38% across presets, while the jump from 1440p to 4K reduces them by an additional 48-50%. This non-linear scaling suggests memory bandwidth or pixel fill rate constraints on the GPU at higher resolutions, rather than a pure compute bottleneck.
The Verdict
Based on the verdictByResolution data, this PC can run Pc Building Simulator at all three tested resolutions, but with different levels of quality. At 3840x2160, the only playable setting is Low, which averages 63 FPS. This is technically above the 60 FPS threshold, but with minimal margin and no room for settings customization. Users prioritizing 4K will need to accept the lowest visual preset.
At 2560x1440, the playable settings are High, Low, and Medium. The best setting is High at 61 FPS average, which meets the threshold but leaves little headroom for demanding scenes. Medium offers a more comfortable 86 FPS average, and Low reaches 121 FPS. Ultra is not playable at this resolution, averaging 58 FPS.
At 1920x1080, all four settings are playable: High at 96 FPS, Low at 192 FPS, Medium at 136 FPS, and Ultra at 91 FPS. The best setting is Ultra, which provides the highest visual quality while still averaging well above 60 FPS. This is the resolution where this combination shines, delivering a fully maxed-out experience without compromise.
The overall verdict is that this system is a capable 1080p machine for this game, a decent 1440p machine with settings caveats, and a marginal 4K machine limited to low quality. Users targeting 1440p should consider dropping to Medium if they want consistent performance above 70 FPS, while 4K users should temper expectations.
CPU and GPU Roles
The data reveals how the CPU and GPU share responsibility across resolutions. At 1920x1080, the frame rates are high enough (91-192 FPS) that the CPU's 8-core, 16-thread configuration with a boost clock of 4.60 GHz is likely handling the simulation logic and object updates without becoming a bottleneck. The GPU's 11.52 TFLOPS of FP32 compute and 380.0 GB/s memory bandwidth are sufficient for the relatively simple rendering tasks at this resolution.
Moving to 2560x1440, the GPU begins to take a more prominent role. The average FPS at High drops to 61, while the CPU has less work per frame relative to the increased pixel output. The Ultra preset at 58 FPS shows that the GPU is the limiting factor, as raising settings from High to Ultra only costs 3 FPS, suggesting the extra effects are not heavily taxing the GPU but the overall resolution is. The CPU's 51.2 GB/s memory bandwidth and Zen 3 architecture are not the constraint here.
At 3840x2160, the GPU is decisively the bottleneck. The Low preset at 63 FPS and Medium at 45 FPS show a steep drop that correlates with the 4x increase in pixel count from 1080p. The GPU's 160-bit memory bus and 10 GB GDDR6 capacity are stressed at this resolution, and the 200.0 GPixel/s pixel rate becomes a limiting factor. The CPU, by contrast, has ample headroom, as evidenced by the single-thread benchmark score of 901 in 3dmark and the Cinebench R23 single-core score of 2916.
The pattern is clear: at low resolutions, the CPU and GPU are balanced; at high resolutions, the GPU dominates the performance equation. This is typical for simulation games where the CPU handles game logic but the GPU must render increasingly complex scenes as pixel count rises.
FAQ
Q: What is the maximum playable setting at 3840x2160?
A: The Low preset is the only playable option at 4K, averaging 63 FPS. Medium drops to 45 FPS average, which is below the 60 FPS threshold.
Q: Can this system run the game at Ultra settings at 2560x1440?
A: No. Ultra at 1440p averages 58 FPS, just missing the 60 FPS requirement. High is the best playable preset at 61 FPS average.
Q: How many FPS does the game achieve at 1080p with High settings?
A: The High preset at 1920x1080 averages 96 FPS, with no minimum or maximum values recorded in the data.
Q: What is the frame rate range for Medium settings at 1920x1080?
A: Medium at 1080p averages 136 FPS, with a minimum of 115 FPS and a maximum of 156 FPS.
Q: Is the Ultra preset playable at 1080p?
A: Yes, Ultra at 1920x1080 averages 91 FPS, which is comfortably above the 60 FPS playable threshold.
Q: How does the CPU compare to its nearest rival in aggregate benchmarks?
A: The AMD Ryzen 7 5700 has an average benchmark score of 25517. Its closest rival, the AMD Ryzen 5 7640U, scores 25485, a delta of 0.1%, making them nearly identical in performance.
How This Combo Ranks
This specific CPU and GPU combination ranks 2997 out of 3723 tested combos in Pc Building Simulator. This places it in the lower portion of the database, around the 20th percentile of all tested systems. The rank reflects the fact that while this hardware can run the game at 1080p and 1440p with adjusted settings, it struggles at 4K beyond low quality.
The ranking is influenced by the GPU's percentileVsAllGpus of 65, meaning it performs better than 65% of all tested GPUs, and the CPU's percentileVsAllCpus of 78, outperforming 78% of CPUs. However, the combination's rank of 2997 out of 3723 suggests that many other pairings offer higher frame rates at higher resolutions, particularly those with more powerful GPUs that can sustain 4K Ultra settings.
For context, the combo is not a top-tier performer, but it is far from the bottom. The data indicates that this system is best suited for 1080p gaming at maximum quality, with 1440p as a secondary option at High or Medium presets. The 4K experience is limited to Low, which may disappoint users with high-resolution displays. Given the CPU's strong relative standing and the GPU's mid-tier position, the bottleneck is clearly the graphics card when pushing higher resolutions.