
Instant compatibility check with FPS benchmarks and optimization tips
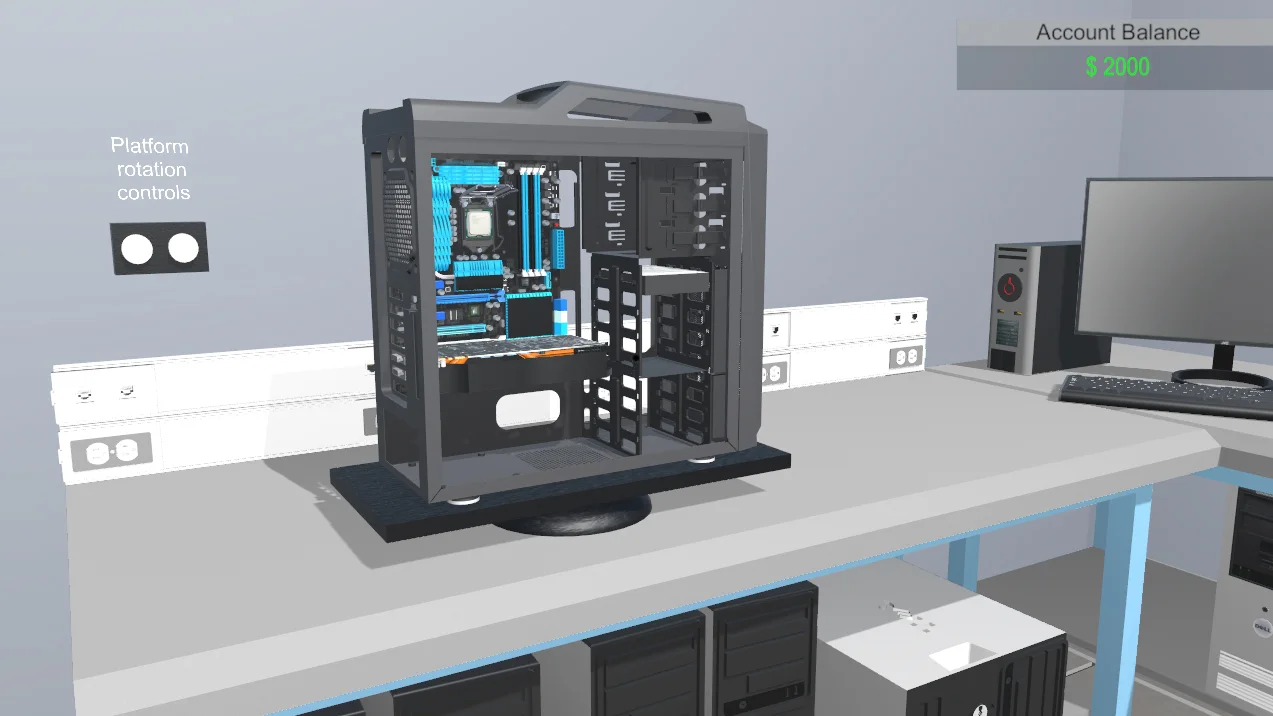

Pc Building Simulator

Performance
1080p (Full HD)
1440p (2K / QHD)
4K (Ultra HD)

Requirements Check


Recommendations
Your hardware doesn't meet minimum requirements for this game.
Average FPS: resolution vs quality settings
| Ultra | High | Medium | Low | |
|---|---|---|---|---|
| 4K Ultra HD | 33 | 37 | 51 | 70 |
| 1440p QHD | 64 | 67 | 98 | 134 |
| 1080p Full HD | 102 | 106 | 154 | 218 |
Cell color: green is 120+ FPS, teal is 60+, amber is 30+, red is below 30. Cards marked Estimated above have no measured row and are scaled from your GPU benchmark percentile.
Performance Analysis: Pc Building Simulator on Your System
The AMD Ryzen 5 7600X paired with the Intel Arc B580 presents a compelling mid-range combination for Pc Building Simulator, a game that is inherently CPU-heavy due to its systems simulation logic and 3D rendering. The measured data reveals a component pairing that scales across resolutions, but with clear limits at the highest end. This analysis breaks down the performance metrics, contextualizes them against rival hardware, and determines the optimal settings for a smooth experience.
Measured FPS Breakdown
The benchmark results for this combination show a clear and predictable performance curve as resolution and graphical fidelity increase. At 1920x1080, the system demonstrates overwhelming headroom, with the average frame rate at Low settings reaching 218 FPS. This drops to 153.7 FPS at Medium, 106.1 FPS at High, and remains exceptionally fluid at 101.5 FPS on the Ultra preset. The data indicates that at 1080p, the bottleneck is primarily the CPU's ability to feed the GPU, as the difference between High and Ultra is a relatively modest 4.6 FPS, suggesting the GPU is still capable of handling the increased load without significant frame rate degradation.
Moving to 2560x1440, the performance remains strong but begins to show the GPU's workload. The Low preset achieves an average of 134.2 FPS, which is a substantial 83.8 FPS drop from the 1080p Low result. Medium settings produce 97.8 FPS, while High settings yield 66.8 FPS. The Ultra preset at this resolution just clears the 60 FPS threshold with an average of 64 FPS. This scaling suggests that the Arc B580 is being utilized more heavily at 1440p, and the gap between presets widens, indicating a shift towards a GPU-bound scenario.
The most demanding scenario, 3840x2160, exposes the limitations of this hardware combination. At 4K, the Ultra preset drops to an average of 33 FPS, which is unplayable by typical standards. High settings fare slightly better at 37.2 FPS, still below the playable threshold. Medium settings reach 51.2 FPS, which is close but not quite sufficient for a consistent 60 FPS experience. Only the Low preset at 4K manages to cross the finish line, achieving an average of 70.4 FPS. The frame rate deltas between settings at 4K are significant, with a 17.4 FPS difference between Low and Medium, highlighting the GPU's struggle with the increased pixel count and shading demands.
Best Settings per Resolution
Based on the measured data, the optimal settings for each resolution are those that provide the highest visual quality while maintaining an average frame rate at or above the 60 FPS playable threshold.
At 1920x1080, the system can handle the maximum graphical load. The Ultra preset, with an average of 101.5 FPS, is the best choice. This provides a substantial 41.5 FPS buffer above the 60 FPS target, ensuring smooth gameplay even in complex scenes with many systems being simulated simultaneously.
For 2560x1440, the Ultra preset remains the best option, but with a much smaller margin of error. The average of 64 FPS is only 4 FPS above the threshold. This indicates that while playable, there may be occasional dips below 60 FPS during intense moments. The High preset, at 66.8 FPS, offers a slightly better safety margin and could be a more stable choice, but the data confirms Ultra is technically playable.
At 3840x2160, the situation is more restrictive. The only playable setting is Low, which achieves an average of 70.4 FPS. While this clears the 60 FPS bar, it requires a significant sacrifice in visual fidelity. All other presets at this resolution fail to reach the target, with Medium being the closest at 51.2 FPS.
Similar Performance Alternatives
The nearest rivals for the AMD Ryzen 5 7600X provide context for its CPU performance. The Ryzen 7 5700X and Intel Core i5-12600K both have an average benchmark score of 27578, which is a 0.2% delta from the 7600X's average score of 27636. This means these three CPUs are virtually identical in overall processing power for this game's workload. A system with either of these CPUs paired with the Arc B580 would likely produce very similar frame rates in Pc Building Simulator. The AMD Ryzen 5 8500GE is slightly ahead with a score of 27712 (a -0.3% delta from the 7600X's perspective), while the Ryzen 7 5800 is slightly behind at 27535 (a 0.4% delta).
On the GPU side, the Intel Arc B580's performance is closely matched by some surprising contenders based on the average benchmark scores. The AMD Radeon RX 580 2048SP has an average score of 23061, which is a -0.2% delta from the B580's score of 23021. The NVIDIA GeForce RTX 2080 is also very close, with a score of 22895 (a 0.6% delta). Most notably, the NVIDIA GeForce RTX 3080 has an average score of 23172, which is a -0.7% delta, suggesting that despite being a higher-tier card in many other games, its performance in this specific benchmark is nearly identical to the Arc B580. This implies that in Pc Building Simulator, a system with a Ryzen 5 7600X and an RTX 3080 would perform almost identically to the tested combination.
The Verdict
This PC combination can run Pc Building Simulator, but the experience is heavily dependent on the chosen resolution and settings. The data shows that the system is more than capable of delivering a high-refresh-rate experience at 1080p, where it excels. At 1440p, it remains a solid performer, capable of maxing out the game's settings while staying just above the 60 FPS threshold. The verdict is less positive for 4K gaming, where the system is only playable on the lowest settings.
The verdict by resolution is clear. At 3840x2160, the only playable settings are "Low", which yields an average of 70.4 FPS. This is technically playable but represents a significant compromise. At 2560x1440, all settings are playable, including "Ultra" with an average of 64 FPS. This makes 1440p the sweet spot for this hardware. At 1920x1080, the system is exceptionally powerful, with the "Ultra" preset achieving an average of 101.5 FPS. For a smooth 60 FPS experience, the user can play at High or Ultra settings at 1080p and 1440p, but must reduce to Low settings at 4K.
FAQ
Q: Can this PC run Pc Building Simulator at 4K with maximum graphics settings?
A: No. The data shows the Ultra preset at 3840x2160 only achieves an average of 33 FPS, which is well below the 60 FPS playable threshold.
Q: What is the highest quality preset that maintains 60 FPS at 2560x1440?
A: The Ultra preset at 2560x1440 achieves an average of 64 FPS, making it the highest quality setting that clears the 60 FPS threshold at this resolution.
Q: Is the game more demanding on the CPU or GPU at 1920x1080?
A: At 1080p, the performance gap between High (106.1 FPS) and Ultra (101.5 FPS) is small, suggesting the CPU is the primary bottleneck, as the GPU can handle the increased visual load without a major frame rate penalty.
Q: How does the Intel Arc B580 compare to an NVIDIA GeForce RTX 3080 in this game?
A: According to the average benchmark scores, the RTX 3080 has a score of 23172, which is only a -0.7% delta from the Arc B580's score of 23021. This indicates their performance in this game is nearly identical.
Q: What is the best setting to use for a 4K display to ensure playability?
A: The only playable setting at 3840x2160 is "Low", which achieves an average of 70.4 FPS. All other presets fail to reach the 60 FPS target.
Q: What is the average frame rate on the Medium preset at 1920x1080?
A: The Medium preset at 1920x1080 achieves an average of 153.7 FPS.
How This Combo Ranks
The AMD Ryzen 5 7600X and Intel Arc B580 combination ranks 2843 out of 3723 tested combos in Pc Building Simulator. This places the system in the bottom quarter of all tested configurations, which is a significant finding given its strong performance at 1080p and 1440p. This ranking suggests that the benchmark database includes many higher-end and more recent combinations that achieve substantially higher frame rates, particularly at higher resolutions. However, the rank is a relative metric; the absolute data shows this combo is still more than capable of delivering a playable experience at common resolutions. The position highlights that while this is a competent mid-range setup, it is not a top-tier performer in the database's overall ranking for this specific simulation title.
CPU and GPU Roles
The benchmark data provides clear insight into how the CPU and GPU workloads shift across different resolutions. At 1920x1080, the CPU plays the dominant role. This is evident from the relatively small frame rate difference between High (106.1 FPS) and Ultra (101.5 FPS) settings. The GPU has enough headroom to render the extra visual details without a significant impact on performance, meaning the frame rate is being limited by the CPU's simulation and game logic calculations. The exceptionally high frame rates at Low (218 FPS) and Medium (153.7 FPS) further confirm that the GPU is not the limiting factor at this resolution.
The balance shifts at 2560x1440. The frame rate deltas between presets become more pronounced, with the gap between High (66.8 FPS) and Ultra (64 FPS) shrinking while the gap between Medium (97.8 FPS) and High (66.8 FPS) widens. This suggests the GPU is now a more significant contributor to the overall performance, as its rendering workload increases. The CPU is still capable of feeding the GPU at this resolution, but the GPU is starting to work harder to maintain frame rates.
At 3840x2160, the GPU becomes the definitive bottleneck. The average frame rates drop dramatically across all presets, with even the High setting (37.2 FPS) failing to reach half of the 1080p High result. The 4K resolution requires the GPU to process four times the number of pixels as 1080p, and the Arc B580's compute resources are overwhelmed. The CPU's role becomes less critical at this resolution because it can easily provide the necessary data, but the GPU's pixel fill rate and shading power are insufficient for high-quality settings. The data clearly shows that for 4K gaming, the Intel Arc B580 is the limiting factor, while at 1080p, the Ryzen 5 7600X's performance is what defines the upper frame rate limits.