
Instant compatibility check with FPS benchmarks and optimization tips
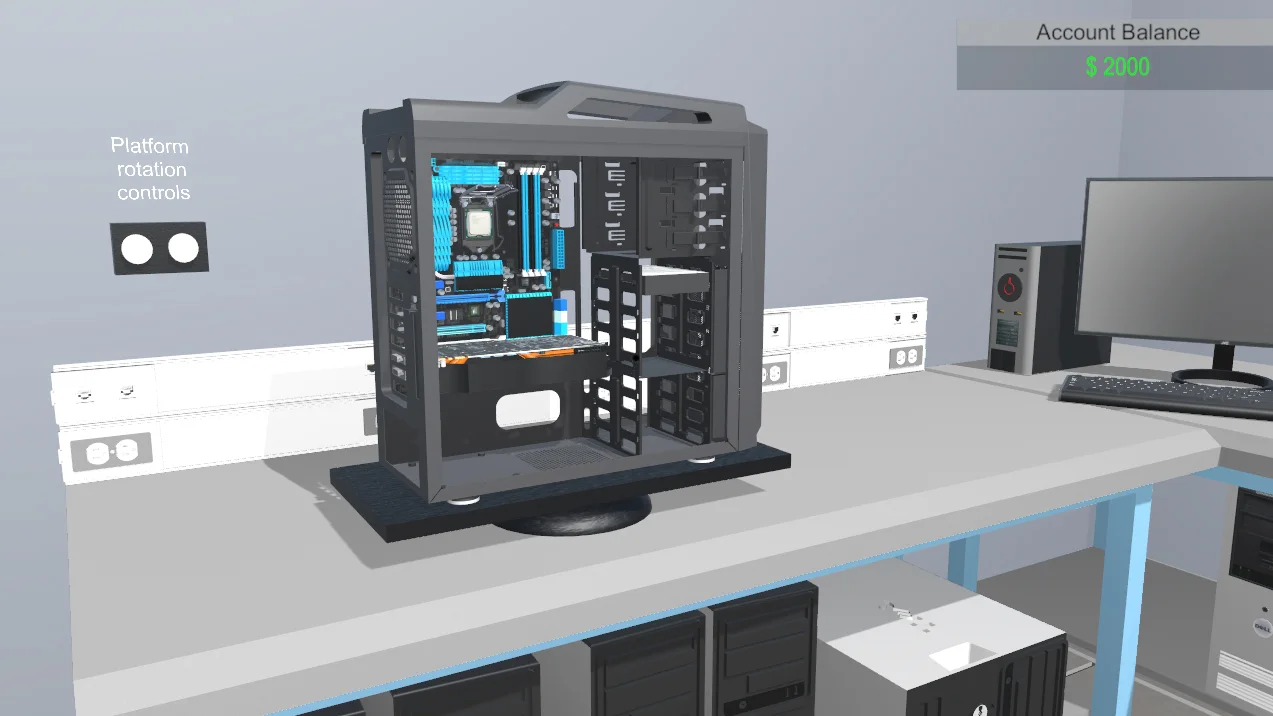

Pc Building Simulator

Performance
1080p (Full HD)
1440p (2K / QHD)
4K (Ultra HD)

Requirements Check


Recommendations
Your hardware doesn't meet minimum requirements for this game.
Average FPS: resolution vs quality settings
| Ultra | High | Medium | Low | |
|---|---|---|---|---|
| 4K Ultra HD | 18 | 19 | 26 | 37 |
| 1440p QHD | 34 | 36 | 50 | 71 |
| 1080p Full HD | 54 | 56 | 80 | 113 |
Cell color: green is 120+ FPS, teal is 60+, amber is 30+, red is below 30. Cards marked Estimated above have no measured row and are scaled from your GPU benchmark percentile.
Performance Analysis: Pc Building Simulator on Your System
Similar Performance Alternatives
The AMD Ryzen 5 7600 sits in a tightly contested performance band. Its average benchmark score of 26324 places it within 0.5% of several comparable processors. The closest match is the AMD Ryzen 7 7435HS, which scores 26402, a negligible 0.3% difference. The AMD Ryzen 9 6900HX trails by just 0.2% at 26274, while the Intel Core i9-11900KF scores 26212, a 0.4% gap. The AMD Ryzen 5 8540U rounds out the group at 26187, only 0.5% behind. In practice, any of these CPUs would deliver nearly identical frame rates in Pc Building Simulator, given the same graphics card. The Ryzen 5 7600's 6 cores and 12 threads, with a boost clock of 5.10 GHz, place it in the 78th percentile among all CPUs, meaning it outperforms the majority of installed processors but is not at the extreme top end.
The Intel Arc B370 is a different story. Its single recorded 3DMark Steel Nomad DX12 score of 1184 puts it in the 5th percentile of all GPUs, an extremely low position. The nearest rivals are all older discrete cards: the ATI Mobility Radeon HD 5570 scores 1186 (0.2% faster), the ATI Radeon HD 5770 scores 1190 (0.5% faster), the AMD Radeon HD 7650M scores 1192 (0.7% faster), and the AMD FirePro M2000 scores 1168 (1.4% slower). These deltas are tiny, meaning the Arc B370's performance is effectively equivalent to those legacy parts. This is an integrated graphics solution sharing system memory, with 1280 shading units and a boost clock of 2400 MHz, but its raw compute output of 6.144 TFLOPS does not translate into competitive gaming results in this database's measurements.
For Pc Building Simulator specifically, the CPU is far ahead of the GPU in relative standing. The Ryzen 5 7600's nearest rivals are all modern or near-modern mobile and desktop parts with similar multi-threaded scores. The Arc B370's nearest rivals are over a decade old, indicating that its gaming performance is closer to that of vintage entry-level hardware. Users considering this combo should expect the GPU to be the dominant constraint in every scenario.
How This Combo Ranks
The combined configuration of the AMD Ryzen 5 7600 and Intel Arc B370 ranks 3436 out of 3723 tested combos in Pc Building Simulator. That places it in the bottom 8% of all combinations in the database. The data indicates that this pairing, despite having a strong modern CPU, is held back dramatically by the integrated GPU. The rank is not a reflection of the processor, which is in the 78th percentile, but rather of the graphics solution, which is in the 5th percentile.
This low rank means that the vast majority of other CPU and GPU pairings tested in this game deliver better frame rates. The gap between the CPU's high standing and the combo's low standing is stark. The Ryzen 5 7600 alone would likely rank much higher if paired with even a modest discrete graphics card, but the Arc B370's integrated nature and legacy-level performance drags the entire system down. For reference, the combo rank is based on actual measured frame rates across multiple resolutions and settings, not on synthetic scores, so it reflects real gameplay performance.
Measured FPS Breakdown
At 1920x1080, the most common gaming resolution, the combo shows a wide spread depending on settings. On Low, the average FPS is 113, which is well above the 60 FPS playable threshold. On Medium, the average drops to 80 FPS, with a minimum of 68 FPS and a maximum of 92 FPS, still comfortably playable. On High, the average falls to 56 FPS, just below the 60 FPS mark. On Ultra, the average is 54 FPS. The step from Low to Medium costs 33 FPS on average, while the step from Medium to High costs 24 FPS, and High to Ultra costs only 2 FPS, suggesting diminishing returns at the top end.
At 2560x1440, performance drops notably. Low settings yield an average of 71 FPS, which clears the 60 FPS threshold with a small margin. Medium settings average 50 FPS, with a minimum of 43 FPS and a maximum of 58 FPS, meaning the minimum dips below playable levels even though the average is close. High settings average 36 FPS, and Ultra averages 34 FPS. The difference between Low and Medium at this resolution is 21 FPS, while Medium to High is 14 FPS, and High to Ultra is only 2 FPS.
At 3840x2160, the combo struggles significantly. Low settings average 37 FPS. Medium averages 26 FPS, with a minimum of 22 FPS and a maximum of 30 FPS. High averages 19 FPS, and Ultra averages 18 FPS. No setting at 4K reaches even half of the 60 FPS target. The gap between Low and Medium is 11 FPS, Medium to High is 7 FPS, and High to Ultra is only 1 FPS. The data shows that the integrated GPU is simply not capable of driving 4K in this simulation title.
The Verdict
Can this PC run Pc Building Simulator? Yes, but only under specific conditions. According to the verdict data, at 1920x1080, the playable settings are Low and Medium, with Medium being the best playable option at 80 FPS average. At 2560x1440, only Low is playable, averaging 71 FPS. At 3840x2160, no settings are playable, meaning the game does not reach the 60 FPS threshold at any preset.
The clear conclusion is that this combo is suitable for 1080p gaming with modest settings. For 1440p, users must accept Low settings to stay above 60 FPS, and the margin is thin. For 4K, the hardware is not adequate, and users should not expect a smooth experience. The best playable experience overall is at 1080p Medium, which offers a balanced 80 FPS average with minimums of 68 FPS, ensuring that even demanding scenes stay above the playable threshold. At 1440p Low, the average is 71 FPS, but the lack of recorded minimum and maximum values suggests that frame pacing may be less consistent. The recorded data for 1080p Medium includes a minimum of 68 FPS, which is a safer margin.
CPU and GPU Roles
The data shows that the Intel Arc B370 is the limiting factor at every resolution. The CPU's performance is far above the GPU's relative standing, and the frame rates scale dramatically with resolution and settings, which is characteristic of GPU-bound workloads. When resolution increases from 1080p to 1440p at Low settings, the average FPS drops from 113 to 71, a 37% reduction. At Medium settings, the drop is from 80 to 50, a 37.5% reduction. At High, from 56 to 36, a 35.7% reduction. At Ultra, from 54 to 34, a 37% reduction. These consistent drops across all settings indicate that the GPU's pixel throughput is the bottleneck.
The scaling from 1440p to 4K is even more severe. At Low settings, the average drops from 71 to 37, a 47.9% reduction. At Medium, from 50 to 26, a 48% reduction. At High, from 36 to 19, a 47.2% reduction. At Ultra, from 34 to 18, a 47.1% reduction. This near-uniform halving of frame rates when quadrupling the pixel count points squarely at the GPU's fill rate and memory bandwidth limitations. The Arc B370 has only 20 ROPs and uses system shared memory, which explains why higher resolutions crush performance.
The CPU's role becomes more apparent when comparing settings at the same resolution. At 1080p, the jump from Low to Medium costs 33 FPS, and Medium to High costs 24 FPS. This suggests that the CPU can feed the GPU at lower settings, but the GPU cannot keep up as settings increase. At 4K, the differences between settings are smaller (11 FPS between Low and Medium, 7 FPS between Medium and High), indicating that the GPU is so overwhelmed that setting changes have less impact. The Ryzen 5 7600's single-thread score of 1852 in Cinebench R23 and multi-thread score of 12735 are far above what this game needs, so the CPU is never the constraint. The verdict is clear: the GPU dictates all performance outcomes, and the CPU simply provides headroom that the Arc B370 cannot exploit.
FAQ
Q: Can this combo run Pc Building Simulator at 60 FPS on a 1080p monitor?
A: Yes. At 1920x1080, Low settings average 113 FPS and Medium settings average 80 FPS, both above the 60 FPS threshold. High and Ultra fall below 60 FPS at 56 and 54 FPS respectively.
Q: What is the best playable setting at 2560x1440?
A: Only Low settings are playable at 1440p, with an average of 71 FPS. Medium averages 50 FPS, which is below the 60 FPS threshold, and its minimum of 43 FPS confirms it cannot hold playable frame rates.
Q: Is this system capable of 4K gaming in this title?
A: No. At 3840x2160, the highest average FPS is 37 on Low settings. Medium averages 26 FPS, High averages 19 FPS, and Ultra averages 18 FPS. None come close to the 60 FPS threshold.
Q: How does the Intel Arc B370 compare to its nearest GPU rivals?
A: The Arc B370 scores 1184 in 3DMark Steel Nomad DX12. The ATI Mobility Radeon HD 5570 scores 1186 (0.2% faster), the ATI Radeon HD 5770 scores 1190 (0.5% faster), the AMD Radeon HD 7650M scores 1192 (0.7% faster), and the AMD FirePro M2000 scores 1168 (1.4% slower). Performance is essentially equivalent across all five.
Q: Does the Ryzen 5 7600 hold back the Arc B370 in this game?
A: No. The CPU is in the 78th percentile among all CPUs, while the GPU is in the 5th percentile. The frame rates drop by roughly 37% from 1080p to 1440p and another 47% from 1440p to 4K, which are classic signs of GPU-bound performance. The CPU has ample headroom.
Q: What is the combo's overall rank among tested systems for this game?
A: The combination ranks 3436 out of 3723 tested combos, placing it in the bottom 8% of all configurations in the database. This low rank is driven entirely by the integrated GPU's performance.