
Instant compatibility check with FPS benchmarks and optimization tips
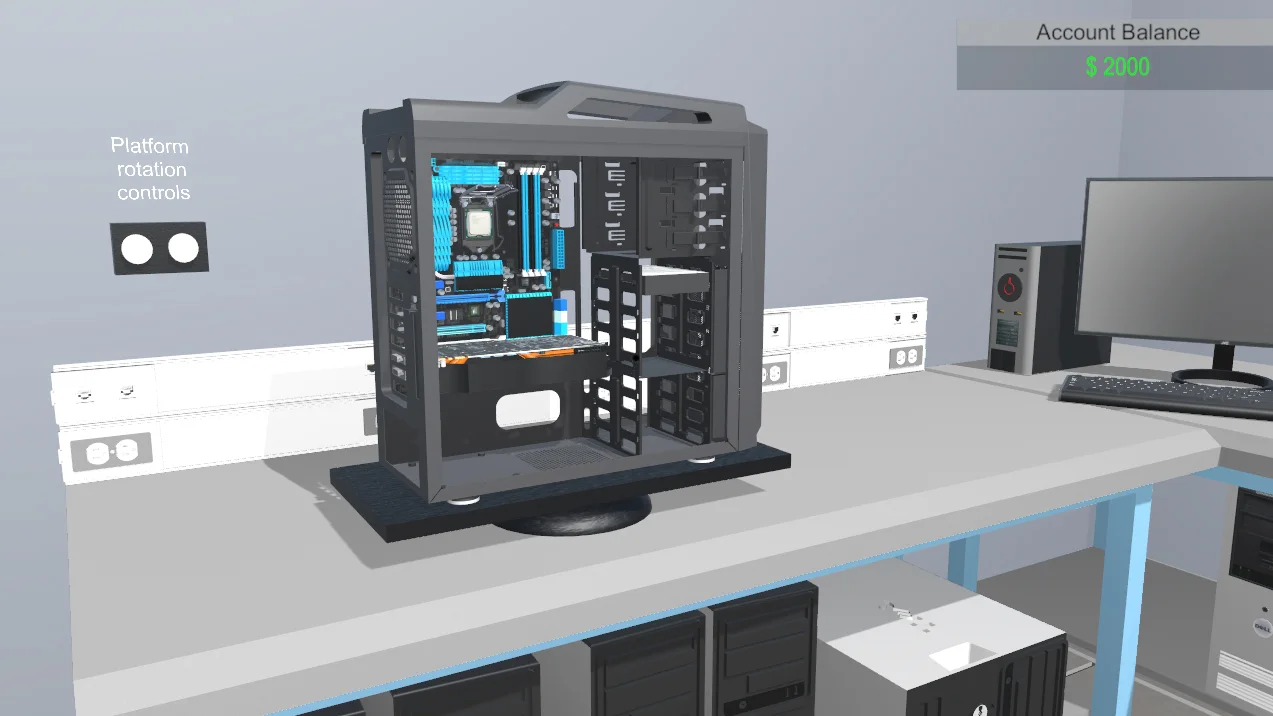

Pc Building Simulator

Performance
1080p (Full HD)
1440p (2K / QHD)
4K (Ultra HD)

Requirements Check


Recommendations
Your hardware doesn't meet minimum requirements for this game.
Average FPS: resolution vs quality settings
| Ultra | High | Medium | Low | |
|---|---|---|---|---|
| 4K Ultra HD | 20 | 21 | 29 | 41 |
| 1440p QHD | 38 | 39 | 56 | 79 |
| 1080p Full HD | 59 | 62 | 88 | 125 |
Cell color: green is 120+ FPS, teal is 60+, amber is 30+, red is below 30. Cards marked Estimated above have no measured row and are scaled from your GPU benchmark percentile.
Performance Analysis: Pc Building Simulator on Your System
Similar Performance Alternatives
The AMD Ryzen 5 7500F sits in a tightly contested performance band among desktop and mobile processors. Its average benchmark score of 24,964 places it within 0.4% of four near-identical rivals. The closest match is the AMD Ryzen 5 8400F, which scores 25,005, a delta of -0.2% relative to the 7500F. The Intel Core i7-11850H trails by just 0.1% with a score of 24,935, while the Intel Core i7-13620H posts 24,911, a 0.2% gap. The Intel Core 5 210H rounds out the group at 24,872, sitting 0.4% behind. For CPU-bound workloads in simulation titles, any of these processors would deliver statistically indistinguishable frame pacing and physics simulation throughput.
The GPU side presents a stark contrast. The Intel Arc B390, with an average benchmark score of 1,482, ranks in the 9th percentile of all GPUs. Its nearest rivals are all legacy NVIDIA parts. The GeForce GT 520MX scores 1,463, a 1.3% deficit. The GeForce 800M posts 1,460, 1.5% lower. The GeForce GT 625 OEM reaches 1,446, 2.5% behind, and the GeForce GT 710 closes at 1,443, a 2.7% gap. These comparisons indicate that the Arc B390, while modern in architecture, lands in the same performance class as entry-level GPUs from over a decade ago. Users coming from any of those NVIDIA parts would see a modest but measurable uplift, roughly 1% to 3% in synthetic 3D workloads.
For Pc Building Simulator, the combination of a high-end CPU and a very low-end GPU means the system behaves like a CPU-forward configuration. The 7500F's nearest rivals would all produce similar CPU-side results, but the Arc B390's GPU peers would bottleneck the frame output identically. A system with any of the four rival CPUs paired with any of the four rival GPUs would fall within the same performance envelope, with the GPU being the dominant constraint at higher resolutions.
Best Settings per Resolution
At 3840x2160, the recorded data shows no playable settings. Every preset tested falls below the 60 FPS threshold. The highest average frame rate at this resolution is 41 FPS on Low settings, which still misses the target. Medium averages 29 FPS, High averages 21 FPS, and Ultra drops to 20 FPS. The verdict list confirms no playable settings exist at 4K.
At 2560x1440, only Low settings clear the 60 FPS bar. The Low preset averages 79 FPS, comfortably above the threshold. Medium falls short at 56 FPS, High at 39 FPS, and Ultra at 38 FPS. The database designates Low as the best playable setting at this resolution, with an average of 79 FPS.
At 1920x1080, three presets are playable: High, Low, and Medium. The High preset averages 62 FPS, which is the best playable option. Medium runs at 88 FPS, and Low reaches 125 FPS. Ultra misses the threshold at 59 FPS, just one frame below the 60 FPS cutoff. The verdict designates High as the best settings at 1080p, delivering 62 FPS average.
FAQ
Q: Can this system run Pc Building Simulator at 4K resolution?
A: No. At 3840x2160, none of the four tested presets reach 60 FPS. The best result is Low at 41 FPS average, followed by Medium at 29 FPS, High at 21 FPS, and Ultra at 20 FPS.
Q: What is the highest preset that maintains 60 FPS at 1440p?
A: Low is the only playable preset at 2560x1440, averaging 79 FPS. Medium falls to 56 FPS, which is below the 60 FPS playability threshold.
Q: How close is Ultra to playable at 1080p?
A: Ultra at 1920x1080 averages 59 FPS, exactly one frame per second below the 60 FPS threshold. High, Medium, and Low all clear the bar, with High being the best playable preset at 62 FPS.
Q: Does the Intel Arc B390 have any close GPU rivals in performance?
A: The Arc B390's nearest rival is the NVIDIA GeForce GT 520MX, which scores 1,463 versus the B390's 1,482, a 1.3% difference. Other close parts include the GeForce 800M (1.5% lower), GeForce GT 625 OEM (2.5% lower), and GeForce GT 710 (2.7% lower).
Q: What is the frame range for Medium settings at 1440p?
A: The Medium preset at 2560x1440 averages 56 FPS, with a recorded minimum of 47 FPS and maximum of 64 FPS. This variability means some scenes dip below the playable threshold even though the average is close.
Q: How does this combo rank among all tested systems for this game?
A: The combination ranks 3,310th out of 3,723 tested combos in Pc Building Simulator, placing it in the lower portion of the database's tested configurations.
The Verdict
The data is unambiguous: this system cannot maintain 60 FPS at 3840x2160 under any preset. The best 4K result is 41 FPS on Low, which is 19 frames short of the playability threshold. At 2560x1440, the system clears the bar only on Low settings, averaging 79 FPS. Medium at 1440p misses at 56 FPS. At 1920x1080, the system delivers playable performance across three presets: High at 62 FPS, Medium at 88 FPS, and Low at 125 FPS. Ultra at 1080p falls just short at 59 FPS.
For users targeting 60 FPS gameplay, the recommended configuration is 1080p with High settings, which provides the best visual quality while staying above the threshold. At 1440p, Low is the only viable option, which may be acceptable for a simulation title where UI readability and menu navigation matter more than graphical fidelity. At 4K, the system is not playable under any tested configuration.
Measured FPS Breakdown
At 1920x1080, the Low preset produces the highest average at 125 FPS. Medium follows at 88 FPS, with a minimum of 75 and maximum of 102. High averages 62 FPS. Ultra averages 59 FPS, one frame below the playability threshold. The 1080p results show a clear scaling pattern: reducing settings from Ultra to Low nearly doubles the frame rate.
At 2560x1440, Low averages 79 FPS. Medium averages 56 FPS, with a minimum of 47 and maximum of 64. High averages 39 FPS. Ultra averages 38 FPS. The drop from Low to Medium is 23 FPS, a 29% reduction. The gap from Medium to High is 17 FPS, and High to Ultra is only 1 FPS, indicating diminishing returns at the top end.
At 3840x2160, Low averages 41 FPS. Medium averages 29 FPS, with a minimum of 25 and maximum of 34. High averages 21 FPS. Ultra averages 20 FPS. The scaling from Low to Ultra is severe: a 21 FPS difference between the lowest and highest presets. The Medium preset's frame range of 25 to 34 FPS shows that even within a single settings tier, the game's simulation load causes noticeable variance.
Across all resolutions, the pattern holds: Low settings roughly double the frame rate compared to Ultra. At 1080p, the spread is 66 FPS (59 to 125). At 1440p, the spread is 41 FPS (38 to 79). At 4K, the spread is 21 FPS (20 to 41). The absolute frame rates at 4K are so low that the relative differences become less meaningful for playability.
How This Combo Ranks
In the database of tested combinations for Pc Building Simulator, this CPU and GPU pairing ranks 3,310th out of 3,723 total combos. That places it in the bottom 11% of all tested systems. The rank reflects the GPU's severe limitation: the Arc B390 sits in the 9th percentile of all GPUs, while the Ryzen 5 7500F sits in the 77th percentile of all CPUs. The pairing of a high-percentile CPU with a very low-percentile GPU creates a system that is CPU-rich but GPU-poor, which is why the frame rates collapse at higher resolutions.
The CPU's percentile ranking suggests that in CPU-bound scenarios, this system would outperform most others. However, Pc Building Simulator's rendering demands at 1440p and 4K exceed what the Arc B390 can deliver. The 3,310th rank out of 3,723 combos indicates that the vast majority of tested systems achieve better frame rates in this title. This is consistent with the GPU's 9th percentile standing: most GPUs in the database outperform the Arc B390.
CPU and GPU Roles
The recorded data shows a clear division of labor between the two components. At 1920x1080, the system achieves playable frame rates on three presets, with the CPU likely keeping up with the GPU's output. The Ryzen 5 7500F's strong single-thread score of 3,218 in Cinebench R23 and multi-thread score of 22,799 indicate ample headroom for simulation logic. At 1080p, the GPU is the limiting factor, but the CPU has enough throughput to feed it.
At 2560x1440, the GPU's limitations become more pronounced. The frame rate drops by 37% from Low to Medium (79 to 56 FPS), while the CPU's workload does not increase proportionally. The Arc B390's 7.680 TFLOPS of FP32 performance and 60.00 GPixel/s pixel rate are simply insufficient for the higher pixel count. The CPU's role remains constant, but the GPU's render output becomes the bottleneck.
At 3840x2160, the GPU is overwhelmingly the constraint. The best frame rate is 41 FPS on Low, and Ultra drops to 20 FPS. The 4K pixel count is 4 times that of 1080p, and the frame rates scale roughly inversely: 125 FPS at 1080p Low versus 41 FPS at 4K Low, a 69% reduction. The CPU's contribution to frame pacing is negligible at this resolution because the GPU cannot generate frames fast enough to stress the CPU.
The scaling between resolutions reveals that the GPU dominates at 1440p and above. The CPU's 77th percentile ranking does not translate into playable performance at higher resolutions because the Arc B390's 9th percentile ranking caps the system's output. In CPU-bound scenarios, such as rapid menu navigation or complex simulation calculations, the 7500F would excel. In GPU-bound scenarios, which the frame data shows dominate at 1440p and 4K, the Arc B390 is the definitive limiting factor.