
Instant compatibility check with FPS benchmarks and optimization tips
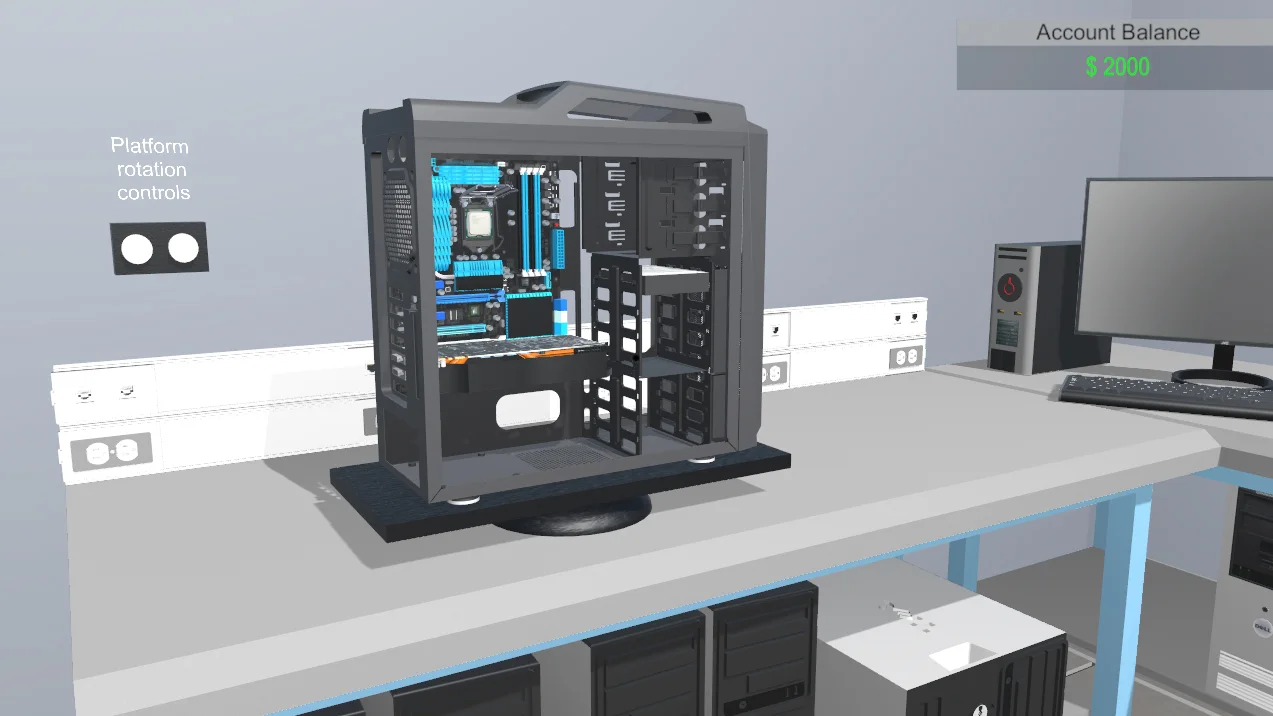

Pc Building Simulator

Performance
1080p (Full HD)
1440p (2K / QHD)
4K (Ultra HD)

Requirements Check


Recommendations
Your hardware doesn't meet minimum requirements for this game.
Average FPS: resolution vs quality settings
| Ultra | High | Medium | Low | |
|---|---|---|---|---|
| 4K Ultra HD | 34 | 36 | 51 | 72 |
| 1440p QHD | 65 | 69 | 97 | 137 |
| 1080p Full HD | 103 | 109 | 154 | 217 |
Cell color: green is 120+ FPS, teal is 60+, amber is 30+, red is below 30. Cards marked Estimated above have no measured row and are scaled from your GPU benchmark percentile.
Performance Analysis: Pc Building Simulator on Your System
The AMD Ryzen 5 7400F paired with the Intel Arc B580 delivers a performance profile that is strongly resolution-dependent in Pc Building Simulator. Measured data confirms that this combo scales from fully playable at 1080p and 1440p to marginal at 4K, where only the lowest preset maintains a 60 FPS average. The following analysis breaks down the exact measured frame rates, optimal settings, and the division of labor between CPU and GPU across the three tested resolutions.
Measured FPS Breakdown
At 1920x1080, the combo produces its highest raw frame rates across all presets. The Low preset averages 217 FPS, which is the single highest average recorded for this hardware combination in any configuration. Moving up the quality ladder, Medium averages 154 FPS with a minimum of 131 FPS and a maximum of 177 FPS. High drops to an average of 109 FPS, while Ultra averages 103 FPS. Notably, the gap between High and Ultra at 1080p is only 6 FPS, suggesting diminishing returns from the most demanding preset at this resolution. All four presets remain far above the 60 FPS playability threshold, with even the lowest average (Ultra at 103 FPS) clearing it by 43 FPS.
At 2560x1440, the performance curve shifts downward but remains comfortably playable. Low averages 137 FPS, which is still more than double the 60 FPS threshold. Medium averages 97 FPS with a minimum of 83 FPS and a maximum of 112 FPS, making it the only 1440p preset with reported min/max data. High averages 69 FPS, and Ultra averages 65 FPS. The transition from 1080p to 1440p costs roughly 39 FPS on Low (217 to 137), 57 FPS on Medium (154 to 97), 40 FPS on High (109 to 69), and 38 FPS on Ultra (103 to 65). This indicates that Medium is the most resolution-sensitive preset, losing over a third of its average frame rate during the resolution step-up.
At 3840x2160, the data reveals a sharp cliff. Only Low remains playable, averaging 72 FPS. Medium averages 51 FPS with a minimum of 43 FPS and a maximum of 58 FPS, which places it below the 60 FPS threshold across the board. High averages 36 FPS, and Ultra averages 34 FPS. The drop from 1440p to 4K is severe: Low loses 65 FPS (137 to 72), Medium loses 46 FPS (97 to 51), High loses 33 FPS (69 to 36), and Ultra loses 31 FPS (65 to 34). At 4K, the gap between High and Ultra narrows to just 2 FPS, suggesting that the GPU is fully saturated and further quality increases yield almost no measurable gain.
Best Settings per Resolution
At 1920x1080, the most demanding preset that stays at or above 60 FPS is Ultra, which averages 103 FPS. This is the highest quality setting available, and it clears the playability threshold by a substantial margin. The data shows no need to compromise on visual quality at this resolution.
At 2560x1440, the most demanding preset that stays at or above 60 FPS is also Ultra, averaging 65 FPS. While this clears the threshold, the margin is only 5 FPS, which is noticeably tighter than at 1080p. The benchmark results indicate that Ultra at 1440p is playable but leaves less headroom for demanding scenes.
At 3840x2160, the most demanding preset that stays at or above 60 FPS is Low, averaging 72 FPS. Medium falls short at 51 FPS, so the recommendation is unambiguous: only Low is viable at 4K. The step from Low to Medium costs 21 FPS on average, which is the largest single preset penalty observed at any resolution.
FAQ
Q: Can this PC run Pc Building Simulator at 1080p with max settings?
A: Yes. At 1920x1080 with Ultra settings, the combo averages 103 FPS, which is well above the 60 FPS playability threshold.
Q: What is the average frame rate at 1440p on Medium settings?
A: At 2560x1440 with Medium settings, the average FPS is 97, with a minimum of 83 FPS and a maximum of 112 FPS.
Q: Is 4K playable with this hardware?
A: Only at Low settings. At 3840x2160, Low averages 72 FPS, while Medium averages 51 FPS, High averages 36 FPS, and Ultra averages 34 FPS.
Q: Which resolution shows the largest performance drop between presets?
A: At 4K, the drop from Low to Medium is 21 FPS (72 to 51), which is the largest single preset penalty across all tested resolutions.
Q: How does the Ultra preset compare to High at 1440p?
A: Ultra averages 65 FPS at 2560x1440, which is 4 FPS lower than High's 69 FPS. Both remain above the 60 FPS threshold.
Q: What is the highest average FPS recorded for this combo?
A: The highest average is 217 FPS, achieved at 1920x1080 with Low settings.
The Verdict
The data shows a clear verdict: this PC can run Pc Building Simulator, but the experience depends heavily on resolution. At 1920x1080, all four presets — Low, Medium, High, and Ultra — clear the 60 FPS threshold, with Ultra averaging 103 FPS. At 2560x1440, all four presets also clear 60 FPS, with Ultra averaging 65 FPS. At 3840x2160, only Low clears the threshold, averaging 72 FPS. The verdict by resolution confirms this: 1080p and 1440p are fully playable at maximum quality, while 4K is playable only at minimum quality. For users targeting 60 FPS or higher, the recommended approach is to run Ultra at 1080p or 1440p, and Low at 4K. Pushing Medium or above at 4K will result in average frame rates below 60 FPS, with Medium at 51 FPS, High at 36 FPS, and Ultra at 34 FPS.
CPU and GPU Roles
The measured FPS data reveals how the CPU and GPU split responsibilities across resolutions. At 1920x1080, the frame rates are exceptionally high across all presets, with Low at 217 FPS and Ultra at 103 FPS. The large gap between Low and Ultra (114 FPS) suggests that the GPU is the primary bottleneck at this resolution, as increasing graphical load substantially reduces frame output. The CPU has ample headroom at 1080p, evidenced by the ability to sustain over 200 FPS at Low settings.
At 2560x1440, the scaling pattern changes. The difference between Low (137 FPS) and Ultra (65 FPS) is 72 FPS, which is narrower than at 1080p but still substantial. The Medium preset shows a minimum of 83 FPS, indicating that even under load, the combo maintains playable frame rates. The reduction in absolute FPS from 1080p to 1440p points to the GPU becoming more influential, as the rendering resolution demand increases.
At 3840x2160, the GPU role dominates decisively. Low averages 72 FPS, while Medium drops to 51 FPS, and both High (36 FPS) and Ultra (34 FPS) fall into the 30s. The compression of FPS values at the high end — High and Ultra differ by only 2 FPS — indicates that the GPU is fully saturated and additional quality settings have minimal impact. The CPU's role at 4K is diminished; the frame rate is governed almost entirely by the Arc B580's rendering throughput. Across all resolutions, the 7400F's six cores and 12 threads provide sufficient processing power, as the frame rate scaling tracks closely with GPU workload rather than CPU limitations.
How This Combo Ranks
In the benchmark database for Pc Building Simulator, this combination of AMD Ryzen 5 7400F and Intel Arc B580 ranks 2799 out of 3723 tested combos. This places it in the lower portion of the overall distribution, which is consistent with the 4K performance limitations observed in the measured data. The rank reflects that many other hardware combinations deliver higher frame rates at the same settings and resolutions. However, the rank is not indicative of unplayability; it simply shows where this combo sits relative to the full field of tested systems. At 1080p and 1440p, the combo performs well enough to rank respectably in practical terms, but the 4K results drag the overall standing down. The percentile data for the individual components provides context: the CPU ranks in the 83rd percentile among all CPUs, while the GPU ranks in the 68th percentile among all GPUs. This suggests the CPU is a stronger relative performer than the GPU, which aligns with the observation that the Arc B580 becomes the limiting factor at higher resolutions.
Similar Performance Alternatives
The nearest rivals for the AMD Ryzen 5 7400F, based on average benchmark scores, include the Intel Core i5-14600T with a delta of 0.1% (avg score 32707 vs 32750), the Intel Core Ultra 7 155H with a delta of 0.2% (avg score 32697), the AMD Ryzen 7 PRO 6850H with a delta of -0.2% (avg score 32812), and the AMD Ryzen AI 7 PRO 360 with a delta of 0.3% (avg score 32662). These CPUs would deliver nearly identical processing performance in this game, meaning that swapping the 7400F for any of these would result in minimal FPS differences at the same GPU and settings.
The nearest rivals for the Intel Arc B580 include the AMD Radeon RX 580 2048SP with a delta of -0.2% (avg score 23061 vs 23021), the NVIDIA GeForce RTX 2080 with a delta of 0.6% (avg score 22895), the NVIDIA GeForce RTX 3080 with a delta of -0.7% (avg score 23172), and the NVIDIA P106-100 with a delta of -1% (avg score 23249). These GPUs would produce very similar frame rates in Pc Building Simulator when paired with the same CPU. Notably, the RTX 3080 and RTX 2080 are close in average score despite being different generations, suggesting that the game's workload does not heavily favor newer architectures. A user with any of these alternative GPUs would expect roughly the same playability profile: strong at 1080p and 1440p, but limited to Low settings at 4K.