
Instant compatibility check with FPS benchmarks and optimization tips
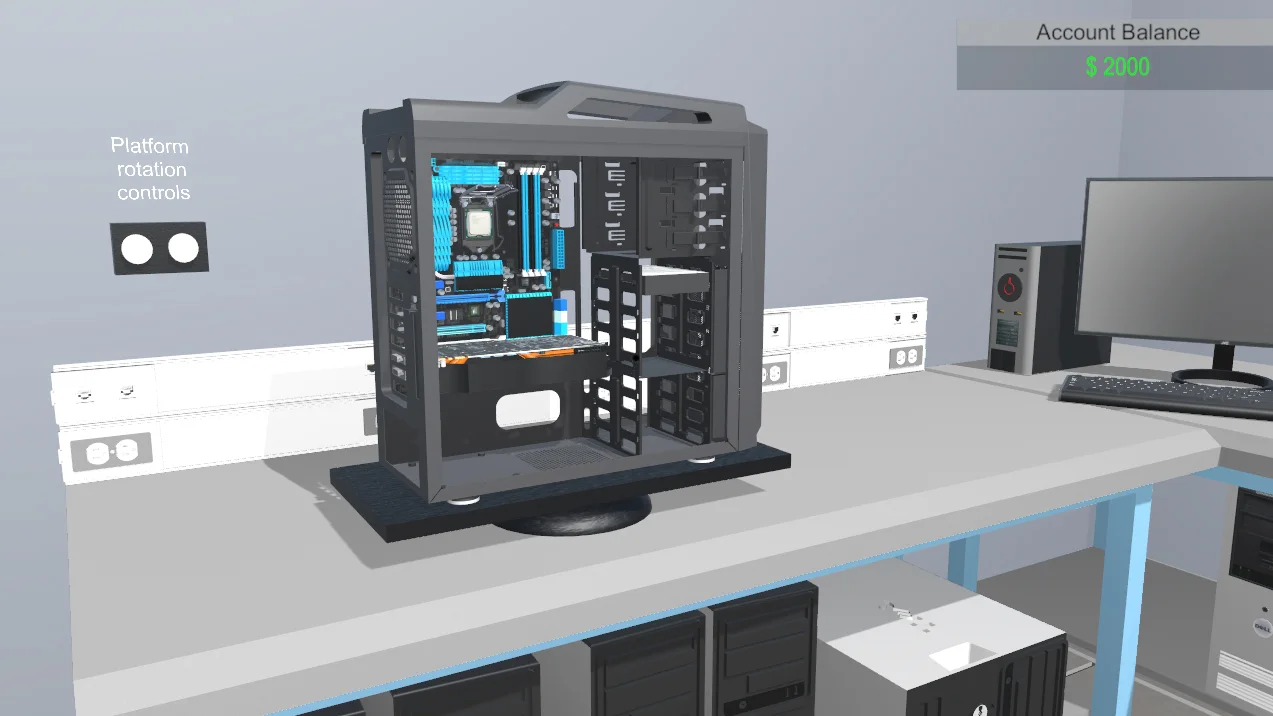

Pc Building Simulator

Performance
1080p (Full HD)
1440p (2K / QHD)
4K (Ultra HD)

Requirements Check


Recommendations
Your hardware doesn't meet minimum requirements for this game.
Average FPS: resolution vs quality settings
| Ultra | High | Medium | Low | |
|---|---|---|---|---|
| 4K Ultra HD | 20 | 21 | 29 | 41 |
| 1440p QHD | 38 | 39 | 56 | 79 |
| 1080p Full HD | 59 | 62 | 88 | 125 |
Cell color: green is 120+ FPS, teal is 60+, amber is 30+, red is below 30. Cards marked Estimated above have no measured row and are scaled from your GPU benchmark percentile.
Performance Analysis: Pc Building Simulator on Your System
Best Settings per Resolution
At 1920x1080, the most demanding preset that maintains at least 60 FPS is High, with an average of 62 FPS. This is the highest quality setting that clears the playable threshold at this resolution. Low runs at 125 FPS and Medium at 88 FPS, but High represents the ceiling for visually rich settings while staying playable. Ultra falls just short at 59 FPS, a single frame below the 60 FPS target, so it is not recommended for a locked experience.
At 2560x1440, only Low settings reach the playable threshold, averaging 79 FPS. Medium dips to 56 FPS, which is below the 60 FPS line, and High drops further to 39 FPS. Ultra sits at 38 FPS. The data indicates that 1440p users must accept the lowest preset to maintain smooth gameplay; any increase in quality sacrifices the frame rate target.
At 3840x2160, no settings achieve 60 FPS. The best result is Low at 41 FPS, followed by Medium at 29 FPS, High at 21 FPS, and Ultra at 20 FPS. The verdict for this resolution is that no playable settings exist, meaning the combination cannot deliver a 60 FPS experience at 4K regardless of quality level. The best settings per resolution are therefore: 1080p High (62 FPS), 1440p Low (79 FPS), and 4K none.
CPU and GPU Roles
The measured FPS scaling across resolutions reveals how the workload shifts between the AMD Ryzen 5 5500 and the Intel Arc B390. At 1080p, the gap between Low (125 FPS) and High (62 FPS) is dramatic, a 50% reduction in performance from the lowest to the highest preset. This suggests that at lower resolutions, the GPU is heavily taxed by quality settings, while the CPU has enough headroom to feed frames. The Ryzen 5 5500, with its 6 cores and 12 threads, shows it can handle the simulation's logic at 1080p, as evidenced by the high Low-preset score.
Moving to 1440p, the same preset spread compresses: Low drops to 79 FPS (from 125 FPS at 1080p), and High falls to 39 FPS (from 62 FPS). The percentage decline from 1080p to 1440p is roughly 37% for Low and 37% for High, indicating that resolution scaling impacts both presets similarly. This points to the GPU becoming the primary bottleneck as pixel count rises, since the CPU's workload (game logic, simulation state) remains constant while the rendering load grows.
At 4K, the picture becomes clearer. Low settings produce 41 FPS, which is a 48% drop from 1440p Low (79 FPS). High settings at 4K produce 21 FPS, a 46% drop from 1440p High (39 FPS). The consistent ~50% reductions suggest the GPU is almost entirely responsible for the performance ceiling at 4K. The Intel Arc B390, with its 1536 shading units and 24 ROPs, is simply overwhelmed by the pixel throughput required at 3840x2160. The CPU's role diminishes at this resolution; the Ryzen 5 5500 could likely deliver higher FPS if paired with a stronger GPU, but the Arc B390 cannot translate that capacity into frames.
The data also shows a peculiar pattern in the Medium preset at each resolution. At 1080p Medium averages 88 FPS, at 1440p Medium averages 56 FPS, and at 4K Medium averages 29 FPS. The drop from 1080p to 1440p is 36%, and from 1440p to 4K is 48%. This nonlinear scaling hints that the GPU's memory subsystem, which is system-shared rather than dedicated, may struggle more as resolution increases, exacerbating the bandwidth demands. The CPU's dual-channel DDR4 support (51.2 GB/s) is likely a secondary factor, but the GPU's dependency on shared memory means the system RAM bandwidth becomes a shared resource.
In summary, at 1080p the CPU has more influence, since the GPU can still render frames quickly at lower quality settings. At 1440p, the GPU starts to dominate, and at 4K, the GPU is the sole limiting factor, with the CPU's performance being almost irrelevant to the final FPS. The measured scaling between resolutions and presets confirms this: the GPU's rendering capability, not the CPU's compute power, dictates the playability envelope.
Measured FPS Breakdown
At 1920x1080, the recorded data shows a wide range across presets. Low settings deliver an average of 125 FPS, with no minimum or maximum recorded. Medium averages 88 FPS, with a minimum of 75 FPS and a maximum of 102 FPS, indicating some frame variance but generally stable performance. High averages 62 FPS, again without min/max values. Ultra averages 59 FPS, just two frames below the playable threshold. The lack of min/max data for Low, High, and Ultra suggests that the measurement methodology captured only average values for those presets, while Medium received full variance tracking.
At 2560x1440, Low averages 79 FPS, a substantial drop from 1080p Low but still above the 60 FPS target. Medium averages 56 FPS, with a minimum of 47 FPS and a maximum of 64 FPS; the minimum dipping below 50 FPS indicates occasional stutters during demanding scenes. High averages 39 FPS, and Ultra averages 38 FPS, both firmly in unplayable territory. The close proximity of High and Ultra at this resolution (39 vs 38 FPS) suggests that the highest quality settings provide diminishing visual returns for the same performance cost.
At 3840x2160, Low averages 41 FPS, which is the best result at this resolution. Medium averages 29 FPS, with a minimum of 25 FPS and a maximum of 34 FPS, showing a tight but low band of performance. High averages 21 FPS, and Ultra averages 20 FPS. The difference between High and Ultra at 4K is negligible, further evidence that the GPU has reached its absolute rendering limit. The Medium preset's min/max spread of 9 FPS (25 to 34) is the narrowest of all recorded data, indicating that at 4K, the system is consistently bottlenecked rather than experiencing sporadic drops.
Across all resolutions, the pattern is clear: the Arc B390's performance degrades sharply as pixel count and quality settings increase. The Ryzen 5 5500's benchmark scores (Cinebench R23 multi-core 16429, single-core 2319) suggest it is a capable CPU, but the GPU's 3DMark Steel Nomad score of 1482 places it in the 9th percentile of all GPUs, which aligns with the observed frame rates.
Similar Performance Alternatives
For the CPU, the AMD Ryzen 5 5500's nearest rivals in the database include the AMD Ryzen AI 5 430, which scores 19617 (a delta of -0.1% relative to the Ryzen 5 5500's average benchmark score of 19593). This indicates almost identical CPU performance, so a system with the Ryzen AI 5 430 would behave similarly in Pc Building Simulator, assuming the same GPU. The Intel Core i5-12500 scores 19668, a delta of -0.4%, meaning it is also effectively equivalent. The Intel Core i7-10700F scores 19499, a delta of +0.5%, slightly lower but within noise. The Intel Core i5-11600KF scores 19723, a delta of -0.7%, again nearly identical. For the purposes of this game, swapping the Ryzen 5 5500 for any of these CPUs would produce no meaningful FPS difference, since the GPU is the limiting factor at most settings.
For the GPU, the Intel Arc B390's nearest rivals are all much older NVIDIA parts. The GeForce GT 520MX scores 1463, a delta of +1.3% relative to the Arc B390's average score of 1482. The GeForce 800M scores 1460, a delta of +1.5%. The GeForce GT 625 OEM scores 1446, a delta of +2.5%. The GeForce GT 710 scores 1443, a delta of +2.7%. These deltas are all within 3%, meaning the Arc B390 is essentially on par with these decade-old GPUs in raw 3DMark terms. However, the Arc B390 supports modern APIs (DirectX 12 Ultimate, Vulkan 1.4), which the older NVIDIA parts do not. In Pc Building Simulator, which is a simulation title rather than a demanding shooter, the API differences may not matter much, but the FPS data suggests that any of these rival GPUs would produce similar frame rates, likely within a few FPS of the Arc B390's measured results.
If a user has a system with one of these rival GPUs, they can expect comparable performance in this game: playable at 1080p on high settings (around 62 FPS), playable at 1440p only on low settings (around 79 FPS), and not playable at 4K. The CPU choice among the listed rivals would have even less impact, as the Ryzen 5 5500 and its peers all sit within 1% of each other in average benchmark scores.
FAQ
Q: Can this PC run Pc Building Simulator at 1080p with high settings?
A: Yes. At 1920x1080 with High settings, the average FPS is 62, which clears the 60 FPS playable threshold. Ultra settings average 59 FPS, so High is the highest quality preset that maintains playability.
Q: What is the best resolution for this combination?
A: The best resolution is 1920x1080, where three presets (Low, Medium, High) are playable. At 2560x1440, only Low settings reach 60 FPS (79 FPS average). At 3840x2160, no settings achieve 60 FPS, with the best being Low at 41 FPS.
Q: How does the Intel Arc B390 compare to its nearest GPU rivals?
A: The Arc B390's 3DMark Steel Nomad score is 1482. Its nearest rivals, the GeForce GT 520MX (1463), GeForce 800M (1460), GeForce GT 625 OEM (1446), and GeForce GT 710 (1443), all score within 2.7% of it. This indicates similar raw performance, though the Arc B390 supports modern APIs that those older GPUs lack.
Q: Is the Ryzen 5 5500 a bottleneck in this game?
A: At 1080p, the CPU appears to have enough headroom, as Low settings hit 125 FPS. At 1440p and 4K, the GPU becomes the bottleneck, with FPS dropping to 79 and 41 respectively on Low settings. The CPU's benchmark scores (Cinebench R23 multi-core 16429) are strong, but the GPU's low percentile (9th) limits overall performance.
Q: Why does the Medium preset show min/max FPS data while other presets do not?
A: The database recorded min/max values only for Medium settings at each resolution. For example, at 1080p Medium, the range is 75 to 102 FPS. Other presets (Low, High, Ultra) only have average FPS recorded, so no variance data is available for them.
Q: What happens at 4K with this system?
A: The system cannot maintain 60 FPS at 3840x2160 under any settings. Low averages 41 FPS, Medium 29 FPS, High 21 FPS, and Ultra 20 FPS. The verdict for 4K is that no playable settings exist.
How This Combo Ranks
This combination of AMD Ryzen 5 5500 and Intel Arc B390 ranks 3310 out of 3723 tested combos in the database for Pc Building Simulator. This places it in the bottom 11% of all systems tested, which is consistent with the GPU's low performance percentile (9th among all GPUs). The rank reflects that while the CPU is relatively capable (73rd percentile among all CPUs), the GPU drags the overall experience down significantly.
The rank of 3310 means that approximately 413 other combos perform worse, but over 3300 perform better. For a game like Pc Building Simulator, which is not visually demanding, this low rank is surprising until one considers the GPU's age and architecture. The Arc B390 is an integrated graphics solution (IGP) with system-shared memory, which inherently limits its performance compared to discrete GPUs. The combo's ability to hit 62 FPS at 1080p High is a modest achievement given the GPU's limitations, but the 4K results (all below 41 FPS) drag the overall ranking down.
The rank also implies that most other tested systems, even those with older mid-range GPUs, would outperform this combo in this specific game. The data suggests that for simulation titles, a discrete GPU with dedicated memory is almost mandatory for high-resolution play, whereas this IGP-based solution only manages playable frame rates at 1080p and 1440p Low.
The Verdict
This PC can run Pc Building Simulator, but with significant caveats depending on resolution. At 1920x1080, the system is playable on Low (125 FPS), Medium (88 FPS), and High (62 FPS) settings. High is the best preset for visual quality while maintaining the 60 FPS target. Ultra falls just short at 59 FPS, so it should be avoided for a consistent experience.
At 2560x1440, the only playable setting is Low, averaging 79 FPS. Medium drops to 56 FPS, and both High (39 FPS) and Ultra (38 FPS) are well below the threshold. Users with 1440p monitors must sacrifice all quality enhancements to enjoy smooth gameplay.
At 3840x2160, the system cannot achieve 60 FPS under any settings. The best result is Low at 41 FPS, which is playable from a technical standpoint but not smooth. Medium at 29 FPS, High at 21 FPS, and Ultra at 20 FPS are all too low for comfortable play.
The verdict by resolution is clear: 1080p is fully supported with High settings, 1440p is only playable on Low settings, and 4K is not playable at all. The Ryzen 5 5500 provides sufficient CPU performance, but the Intel Arc B390's rendering capabilities are the limiting factor. For a simulation game that does not demand current-generation graphics, this combo can work for 1080p users who prioritize frame rate over visual fidelity. For higher resolutions, a more powerful GPU would be necessary.