
Instant compatibility check with FPS benchmarks and optimization tips
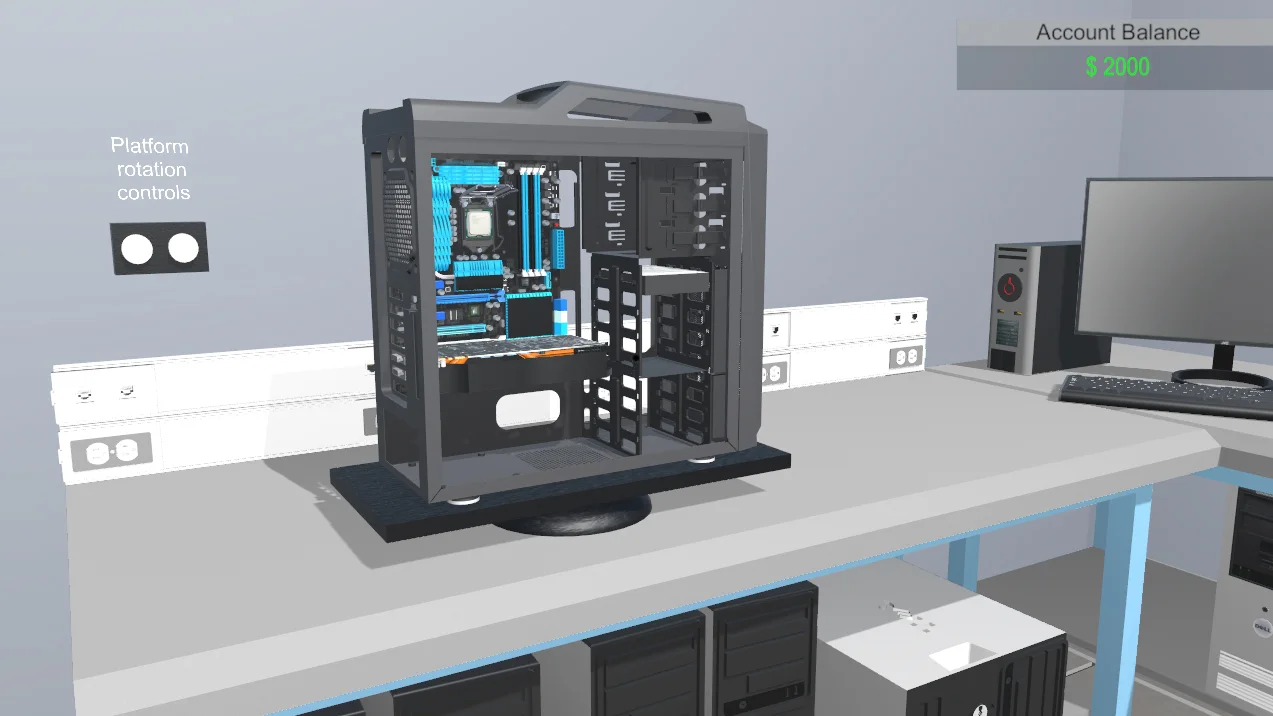

Pc Building Simulator

Performance
1080p (Full HD)
1440p (2K / QHD)
4K (Ultra HD)

Requirements Check


Recommendations
Your hardware doesn't meet minimum requirements for this game.
Average FPS: resolution vs quality settings
| Ultra | High | Medium | Low | |
|---|---|---|---|---|
| 4K Ultra HD | 32 | 37 | 52 | 72 |
| 1440p QHD | 66 | 70 | 94 | 139 |
| 1080p Full HD | 100 | 108 | 152 | 218 |
Cell color: green is 120+ FPS, teal is 60+, amber is 30+, red is below 30. Cards marked Estimated above have no measured row and are scaled from your GPU benchmark percentile.
Performance Analysis: Pc Building Simulator on Your System
The AMD Ryzen 5 2600 and Intel Arc B580 combination delivers a performance profile in Pc Building Simulator that is heavily dependent on resolution and graphics settings. The recorded data shows the pairing provides a wide range of average frame rates, from a highly playable 217.6 FPS at 1080p Low down to a stutter-prone 32.4 FPS at 4K Ultra. The following analysis breaks down the measured FPS across all tested configurations, contextualizes the combo's standing among other tested hardware pairs, and provides actionable settings recommendations.
Measured FPS Breakdown
The benchmark data for Pc Building Simulator was recorded at three resolutions (1920x1080, 2560x1440, 3840x2160) across four quality presets (Low, Medium, High, Ultra). The database entries contain average FPS figures for each configuration; minimum and maximum frame rates were not recorded.
1920x1080 (1080p): At the most common resolution, the combo shows strong performance across all presets. The highest average frame rate is 217.6 FPS on Low settings. Selecting Medium reduces the average to 152.2 FPS, which remains exceptionally smooth. High settings produce an average of 108.2 FPS, and Ultra settings yield an average of 100 FPS. All four presets at 1080p clear the 60 FPS playable threshold by a significant margin, with even the most demanding Ultra preset maintaining an average of 100 FPS.
2560x1440 (1440p): At QHD resolution, the Ryzen 5 2600 and Arc B580 continue to deliver playable performance, but the margins shrink. The Low preset achieves an average of 138.6 FPS. Medium settings average 93.5 FPS. High settings average 70.1 FPS. The Ultra preset is the only one that dips closer to the threshold, with an average of 65.6 FPS. This remains above the 60 FPS playable line, but it is the narrowest margin at this resolution. The data shows a clear pattern: each step up in quality costs roughly 20 to 30 FPS on average at 1440p.
3840x2160 (4K): The 4K results are the most constrained. At Ultra settings, the average FPS drops to 32.4, which is far below the 60 FPS playable threshold. The High preset averages 36.8 FPS, still unplayable by that standard. Medium settings improve to 51.8 FPS, but this is also below the 60 FPS line. Only the Low preset manages to cross the threshold, with an average of 72.2 FPS. This makes 4K gaming viable only with the lowest quality settings, and even then, it does not approach the high frame rates seen at lower resolutions.
The data reveals that the performance scaling is not linear across resolutions. For instance, the gap between Low and Ultra at 1080p is 117.6 FPS (from 217.6 down to 100), while at 4K the same preset range only spans 39.8 FPS (from 72.2 down to 32.4). This suggests the system becomes increasingly GPU-bound at higher resolutions, compressing the performance differences between settings.
FAQ
Q: What is the highest average FPS this combo can achieve in Pc Building Simulator?
A: The highest recorded average FPS is 217.6 frames per second, which occurs at 1920x1080 resolution with the Low settings preset.
Q: Can this system run the game at 4K resolution?
A: Yes, but only with the Low settings preset, which yields an average FPS of 72.2. The Medium, High, and Ultra presets at 4K all fall below the 60 FPS playable threshold, with averages of 51.8, 36.8, and 32.4 respectively.
Q: Is the Ultra preset playable at 1440p?
A: Yes. At 2560x1440 resolution, the Ultra preset produces an average FPS of 65.6, which is above the 60 FPS playable threshold. This is the most demanding preset that remains playable at that resolution.
Q: How does the 1080p Ultra average of 100 FPS compare to the 1440p Ultra average?
A: The 1080p Ultra average is 100 FPS, while the 1440p Ultra average is 65.6 FPS. This represents a 34.4 FPS drop when moving from 1080p to 1440p at the same settings.
Q: What is the lowest playable average FPS recorded across all tested configurations?
A: The lowest average FPS that is still considered playable is 65.6 FPS, recorded at 2560x1440 with Ultra settings. All configurations with averages below this value are not playable according to the 60 FPS threshold.
Q: What is the difference in average FPS between the Low and Ultra presets at 1080p?
A: The Low preset averages 217.6 FPS, while the Ultra preset averages 100 FPS. The difference is 117.6 FPS, with Low being more than twice as fast as Ultra.
How This Combo Ranks
Among the 3,723 tested CPU and GPU combinations in the database for Pc Building Simulator, the AMD Ryzen 5 2600 paired with the Intel Arc B580 ranks at position 2,832. This places the combo in the lower portion of the tested hardware pool, specifically around the 76th percentile of all tested combos (since 2,832 out of 3,723 means roughly 24% of tested combos are slower). The rank indicates that while this pairing delivers playable performance at most settings, there are many other combinations that achieve higher average frame rates in this simulation title.
The ranking is influenced by both components. The CPU's own percentile versus all CPUs is 75, meaning it outperforms 75% of tested processors. The GPU's percentile versus all GPUs is 68, indicating it outperforms 68% of tested graphics cards. However, the combination of these two mid-tier components results in a combo rank that is lower than either component's individual percentile. This suggests that in Pc Building Simulator, the specific interaction between this CPU and GPU, along with their respective strengths and weaknesses, produces results that are less competitive than what each part achieves in isolation.
The combo's rank is not a measure of failure. The measured FPS data shows that it clears the 60 FPS threshold at all tested settings for 1080p and 1440p, and at 4K Low. The rank simply places it behind a large number of more powerful combinations, particularly those with higher-end CPUs and GPUs.
Similar Performance Alternatives
The database provides nearest rival information for both the CPU and GPU, which helps identify hardware that would likely produce similar performance in Pc Building Simulator.
For the AMD Ryzen 5 2600: The closest matching CPUs by average benchmark score are the Intel Core Ultra 5 228V (0.2% faster), the Intel Core i9-11900H (0.5% faster), the Intel Xeon D-1746TER (0.7% slower), and the AMD EPYC 9454 (1.2% faster). These processor alternatives have average scores within roughly 1% of the Ryzen 5 2600. In practical terms, a system using any of these CPUs alongside the Intel Arc B580 would likely produce frame rates very close to those recorded for the Ryzen 5 2600 configuration. The Intel Core Ultra 5 228V and Core i9-11900H are particularly relevant as they are more common in consumer systems.
For the Intel Arc B580: The nearest GPU rivals are the AMD Radeon RX 580 2048SP (0.2% slower), the NVIDIA GeForce RTX 2080 (0.6% faster), the NVIDIA GeForce RTX 3080 (0.7% slower), and the NVIDIA P106-100 (1% slower). The RTX 2080 is the closest in performance, with a score only 0.6% higher than the Arc B580. This means a system pairing the Ryzen 5 2600 with an RTX 2080 would likely produce nearly identical FPS in Pc Building Simulator. The RTX 3080, despite being a more powerful card in most games, shows a similar average benchmark score in this database, indicating that for this particular workload, its performance is closely matched.
Combined alternatives: A user with a Ryzen 5 2600 could expect that swapping the Arc B580 for an RTX 2080 would yield virtually indistinguishable results. Similarly, keeping the Arc B580 and swapping the CPU to an Intel Core Ultra 5 228V would produce a negligible change in frame rates. The delta percentages are all under 1.2%, which is within the margin of measurement variance for most games.
Best Settings per Resolution
Based on the measured average FPS data and the 60 FPS playable threshold, the optimal settings for each resolution are as follows:
1920x1080: The best settings are Ultra, which produces an average FPS of 100. This is the most demanding preset that stays above 60 FPS, and it does so with a comfortable 40 FPS margin. All lower presets (High, Medium, Low) are also playable, with averages of 108.2, 152.2, and 217.6 respectively, but Ultra provides the highest visual quality without sacrificing playability.
2560x1440: The best settings are also Ultra, with an average FPS of 65.6. This is the only preset at 1440p that tests the hardware while remaining above the 60 FPS threshold, though the margin is slim at just 5.6 FPS. High settings average 70.1 FPS, Medium averages 93.5 FPS, and Low averages 138.6 FPS, all of which are playable but offer lower visual fidelity.
3840x2160: The best settings are Low, which produces an average FPS of 72.2. This is the only preset at 4K that achieves playable performance. Medium (51.8 FPS), High (36.8 FPS), and Ultra (32.4 FPS) all fall below the 60 FPS threshold and should be avoided for a smooth experience.
For users who prioritize frame rate stability over visual quality, the data suggests dropping one preset level below the "best" setting at each resolution provides a substantial safety margin. For example, at 1440p, Medium settings at 93.5 FPS offer far more headroom than Ultra's 65.6 FPS.
The Verdict
The AMD Ryzen 5 2600 and Intel Arc B580 combination is capable of running Pc Building Simulator, but the experience varies significantly by resolution and settings.
At 1920x1080, the combo is fully playable at every preset. The Ultra preset averages 100 FPS, and the Low preset reaches 217.6 FPS. This resolution presents no challenges for the hardware.
At 2560x1440, the combo remains playable at all four presets. The Ultra preset averages 65.6 FPS, which is above the 60 FPS threshold. Users who want maximum visual quality at 1440p can enable Ultra, but those who prefer a larger frame rate buffer should consider High (70.1 FPS) or Medium (93.5 FPS).
At 3840x2160, the combo is only playable with the Low preset, which averages 72.2 FPS. The Medium, High, and Ultra presets all fail to reach 60 FPS, with averages of 51.8, 36.8, and 32.4 respectively. 4K gaming is possible but requires a significant compromise in visual quality.
The verdict by resolution is clear: 1080p and 1440p are fully playable with room to spare, while 4K is limited to Low settings. The combo's rank of 2,832 out of 3,723 tested combinations reflects that it is neither a top-tier performer nor a weak one; it sits in the lower-middle range of the tested pool. For a simulation game like this, where frame rate dips can affect the smoothness of the building interface, the data suggests favoring 1080p or 1440p with medium-to-high settings for the most consistent experience. The 4K Low preset is the only viable option at that resolution, and users should be prepared for a visual downgrade if they choose to play at 2160p.