
Instant compatibility check with FPS benchmarks and optimization tips
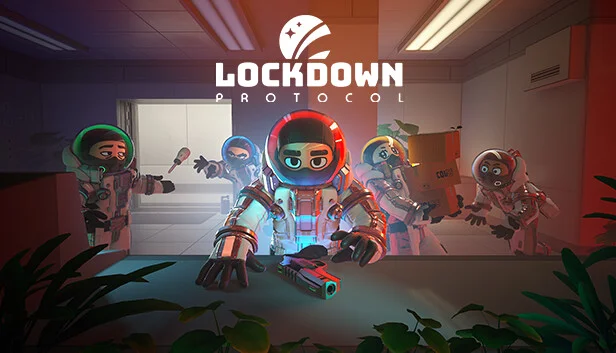

Lockdown Protocol

Performance
1080p (Full HD)
1440p (2K / QHD)
4K (Ultra HD)

Requirements Check


Recommendations
Your hardware doesn't meet minimum requirements for this game.

Your GPU supports ray tracing.
Average FPS: resolution vs quality settings
| Ultra | High | Medium | Low | |
|---|---|---|---|---|
| 4K Ultra HD | 55 | 73 | 84 | 118 |
| 1440p QHD | 85 | 113 | 130 | 183 |
| 1080p Full HD | 116 | 155 | 177 | 249 |
Cell color: green is 120+ FPS, teal is 60+, amber is 30+, red is below 30. Cards marked Estimated above have no measured row and are scaled from your GPU benchmark percentile.
Performance Analysis: Lockdown Protocol on Your System
The pairing of an Intel Core i7-14700K with an NVIDIA GeForce RTX 3080 is a distinctly unbalanced configuration on paper: the processor sits in the 94th percentile of all CPUs tested, while the Ampere-based GPU sits in the 68th percentile. For Lockdown Protocol, a first-person shooter released in March 2024, the measured data shows that this imbalance barely matters. The RTX 3080 has enough headroom to run the game above the 60 FPS playability threshold at every resolution tested, including 4K, and the 20-core, 28-thread Raptor Lake Refresh processor is never the limiting factor. The numbers below break down exactly where the frame rates land.
Measured FPS Breakdown
All results in this dataset are measured, not estimated, and cover three resolutions with four presets each.
At 1920x1080, the frame rates are uniformly high. The Low preset averages 249 FPS, Medium averages 177 FPS with a minimum of 151 and a maximum of 204, High averages 155 FPS, and Ultra averages 116 FPS. Even the most demanding preset clears the 60 FPS threshold by a wide margin — nearly double it, in fact.
At 2560x1440, the curve steps down but stays comfortable: Low averages 183 FPS, Medium averages 130 FPS with a minimum of 110 and a maximum of 149, High averages 113 FPS, and Ultra averages 85 FPS. The Medium preset's minimum of 110 FPS indicates that even worst-case moments in the benchmark run sit well above the playability line.
At 3840x2160, the picture tightens. Low averages 118 FPS and Medium averages 84 FPS with a minimum of 71 and a maximum of 96, so both remain above 60 FPS. High averages 73 FPS — playable, but with less cushion. Ultra averages 55 FPS, which falls below the 60 FPS threshold and is the single failing result in the entire dataset.
Minimum and maximum frame rate data was only captured for the Medium preset, so conclusions about frame-time consistency elsewhere are qualitative rather than quantitative.
CPU and GPU Roles
The scaling behavior between resolutions reveals which component is doing the work. Moving from 1920x1080 to 2560x1440 at Ultra drops the average from 116 FPS to 85 FPS; moving from 1440p to 4K at the same preset drops it further to 55 FPS. That steady decline as pixel count rises — roughly a quarter of the frame rate lost between 1080p and 4K at Ultra — is the signature of GPU-bound operation. If the Core i7-14700K were the bottleneck, raising the resolution would produce much flatter frame rates, since the CPU workload is essentially resolution-independent.
At 1080p the margins between presets compress: the gap between Low and Medium is 72 FPS (249 to 177), while between High and Ultra it is 39 FPS (155 to 116). The persistence of large preset-to-preset deltas even at the lowest resolution indicates the RTX 3080 remains the constraint at 1080p Ultra. The processor's credentials support this reading: a Cinebench R23 multi-core score of 33440.5, a single-core score of 2160, and a PassMark single-thread result of 4472 place it among the fastest gaming CPUs available, and its percentile of 94 against all tested CPUs far exceeds the GPU's 68. In Lockdown Protocol, the data shows the GPU is the component that matters at every resolution.
Best Settings per Resolution
The most demanding preset that holds at or above 60 FPS at each resolution:
- 1920x1080 — Ultra, 116 FPS average. No compromise needed; the top preset runs at nearly double the threshold.
- 2560x1440 — Ultra, 85 FPS average. Again, the highest preset clears 60 FPS with room to spare.
- 3840x2160 — High, 73 FPS average. Ultra's 55 FPS average falls short, making High the ceiling for 4K play. Medium at 84 FPS is an alternative if more headroom is wanted, since its measured minimum is 71 FPS.
Similar Performance Alternatives
On the CPU side, the nearest rivals by aggregate benchmark score are remarkably close. The AMD EPYC 9115 averages 69288 against the i7-14700K's 69355 — a gap of just 0.1 percent — while the AMD Ryzen 9 7950X (69515, −0.2 percent), AMD Ryzen 9 7940HX (69875, −0.7 percent), and AMD Ryzen 7 9700F (69996, −0.9 percent) all sit within one percent. Any of these processors paired with the same GPU would produce indistinguishable results in a GPU-bound title like this one.
On the GPU side, the closest alternatives by average score are an eclectic group: the NVIDIA P106-100 (23249, −0.3 percent), the AMD Radeon Pro Vega 16 (23250, −0.3 percent), the AMD Radeon RX 6600M (23273, −0.4 percent), and the AMD Radeon R9 M290X (23276, −0.4 percent). The RX 6600M is the most consumer-relevant of these; the aggregate scores suggest it would land within a fraction of a percent of the RTX 3080's overall benchmark profile, though per-game behavior can differ from aggregate rankings.
How This Combo Ranks
Against the 3714 hardware combinations tested in Lockdown Protocol, the i7-14700K plus RTX 3080 pairing ranks 1031st. That places it in roughly the top quarter of tested configurations for this specific game. Given that the combo already achieves Ultra at 85 FPS at 1440p, the configurations ranking above it are primarily extracting higher absolute frame rates at 4K or higher-refresh 1440p play — refinements, not capability differences. The rank also reflects the CPU-heavy skew of the pairing: a 94th-percentile processor attached to a 68th-percentile GPU will rank lower in aggregate game testing than either component would individually.
The Verdict
Yes — this PC runs Lockdown Protocol capably at every resolution tested. At 1920x1080 and 2560x1440, all four presets are playable, with Ultra averaging 116 FPS and 85 FPS respectively. At 3840x2160, Low (118 FPS), Medium (84 FPS), and High (73 FPS) all clear the 60 FPS threshold; Ultra at 55 FPS is the only setting that does not. The practical recommendation is simple: 1440p Ultra is the sweet spot for this hardware, and 4K High is entirely viable for players who prioritize resolution over presets.
FAQ
Q: Can the RTX 3080 run Lockdown Protocol at 4K?
A: Yes, at three of four presets. Low averages 118 FPS, Medium 84 FPS, and High 73 FPS. Only Ultra falls short at 55 FPS.
Q: Which settings should be used at 1440p?
A: Ultra, which averages 85 FPS — comfortably above the 60 FPS playability threshold. Every preset at 2560x1440 is playable, with Low reaching 183 FPS.
Q: Is the Core i7-14700K a bottleneck in this game?
A: The data indicates no. Frame rates scale downward consistently as resolution rises, which points to a GPU-bound configuration. The CPU's 94th-percentile ranking far exceeds the GPU's 68th percentile.
Q: How stable are the frame rates?
A: At Medium preset, measured minima are 151 FPS at 1080p, 110 FPS at 1440p, and 71 FPS at 4K — all above 60 FPS even at worst measured moments. Minimum and maximum data was not captured for other presets.
Q: What CPUs would perform similarly with this GPU?
A: Per aggregate benchmark scores, the AMD EPYC 9115 (+0.1 percent), AMD Ryzen 9 7950X (−0.2 percent), AMD Ryzen 9 7940HX (−0.7 percent), and AMD Ryzen 7 9700F (−0.9 percent) are all within one percent of the i7-14700K.
Q: How does this combo rank against other tested systems?
A: It ranks 1031 out of 3714 tested combinations in Lockdown Protocol, placing it in roughly the top quarter.