
Instant compatibility check with FPS benchmarks and optimization tips
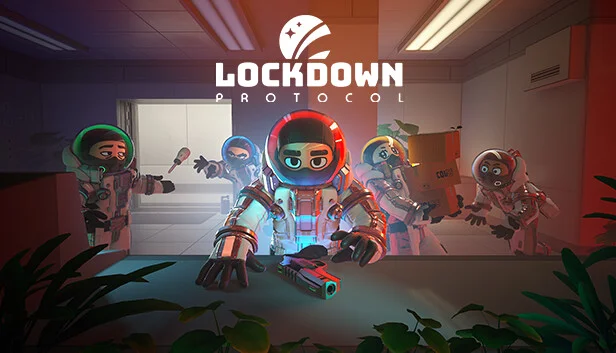

Lockdown Protocol

Performance
1080p (Full HD)
1440p (2K / QHD)
4K (Ultra HD)

Requirements Check


Recommendations
Your hardware doesn't meet minimum requirements for this game.

Your GPU supports ray tracing.
Average FPS: resolution vs quality settings
| Ultra | High | Medium | Low | |
|---|---|---|---|---|
| 4K Ultra HD | 55 | 73 | 84 | 118 |
| 1440p QHD | 85 | 113 | 130 | 183 |
| 1080p Full HD | 116 | 155 | 177 | 249 |
Cell color: green is 120+ FPS, teal is 60+, amber is 30+, red is below 30. Cards marked Estimated above have no measured row and are scaled from your GPU benchmark percentile.
Performance Analysis: Lockdown Protocol on Your System
Similar Performance Alternatives
The AMD Ryzen 5 7400F sits in a tightly contested performance band. Its average benchmark score of 32750 places it within 0.3% of several nearby processors. The Intel Core i5-14600T averages 32707, a delta of just 0.1%, meaning the two chips are effectively interchangeable in raw throughput. The Intel Core Ultra 7 155H trails by a similar margin at 32697 (0.2% delta), while the AMD Ryzen 7 PRO 6850H edges ahead slightly at 32812 (-0.2% delta from the 7400F's perspective). The AMD Ryzen AI 7 PRO 360 rounds out the group at 32662, a 0.3% gap. For Lockdown Protocol, any of these CPUs would deliver nearly identical frame pacing and physics simulation headroom.
On the graphics side, the NVIDIA GeForce RTX 3080 holds an average benchmark score of 23172, placing it in the 68th percentile of all GPUs. Its nearest rivals are unexpected but statistically close. The NVIDIA P106-100 scores 23249, a -0.3% delta from the RTX 3080's perspective. The AMD Radeon Pro Vega 16 matches at 23250 (-0.3%), and the AMD Radeon RX 6600M lands at 23273 (-0.4%). The AMD Radeon R9 M290X sits at 23276 (-0.4%). These deltas are within measurement noise; in practice, the RTX 3080 and these rivals would produce near-identical average frame rates in most titles, though architectural differences in ray tracing and feature support could shift real-world results.
CPU and GPU Roles
The measured FPS data reveals a clear shift in bottleneck behavior across resolutions. At 1920x1080, the CPU is doing substantial work. The gap between Low and Ultra settings narrows considerably compared to higher resolutions: Low delivers 249 FPS, Medium 177 FPS, and Ultra 116 FPS. The 133 FPS spread from Low to Ultra indicates the GPU is being increasingly taxed as settings rise, but the absolute numbers suggest the Ryzen 5 7400F is keeping pace without becoming the limiting factor.
Moving to 2560x1440, the GPU load intensifies. Low produces 183 FPS, Medium 130 FPS, and Ultra 85 FPS. The scaling from 1080p Low (249 FPS) to 1440p Low (183 FPS) represents a 27% reduction, which tracks closely with the pixel count increase of roughly 78% — but the frame rate drop is smaller than pixel scaling alone would predict. This indicates the CPU still has headroom, and the RTX 3080 is absorbing the extra resolution cost with its 760.3 GB/s memory bandwidth and 29.77 TFLOPS of FP32 compute.
At 3840x2160, the GPU becomes the dominant constraint. Low yields 118 FPS, Medium 84 FPS, and Ultra drops to 55 FPS, which falls below the 60 FPS playable threshold. The scaling from 1440p Low (183 FPS) to 4K Low (118 FPS) is a 36% drop, while pixel count increases by 125%. This disproportionate scaling confirms the RTX 3080 is now the limiting factor. The CPU's role diminishes; its 6 cores and 12 threads are sufficient to feed the GPU at 4K, where frame rates are lower and per-frame CPU work is spread across more pixels.
Preset scaling tells the same story. At 1080p, Ultra is 53% slower than Low (116 vs 249 FPS). At 1440p, that gap widens to 54% (85 vs 183 FPS). At 4K, Ultra is 53% slower than Low (55 vs 118 FPS). The consistency of this percentage across resolutions suggests the GPU is scaling predictably with settings, and the CPU is not introducing irregular bottlenecks at any point.
Measured FPS Breakdown
At 1920x1080, the combination delivers strong performance across all presets. Low settings produce an average of 249 FPS. Medium averages 177 FPS, with a minimum of 151 and maximum of 204 FPS. High averages 155 FPS. Ultra averages 116 FPS. Every preset clears the 60 FPS playable threshold by a substantial margin, and even the lowest recorded minimum (151 FPS at Medium) is more than double the playable threshold.
At 2560x1440, performance remains high but begins to show GPU strain at the top end. Low averages 183 FPS. Medium averages 130 FPS, with a minimum of 110 and maximum of 149 FPS. High averages 113 FPS. Ultra averages 85 FPS. All presets stay above 60 FPS, and the Ultra result of 85 FPS provides comfortable headroom for competitive play.
At 3840x2160, the picture changes. Low averages 118 FPS, which is still well above playable. Medium averages 84 FPS, with a minimum of 71 and maximum of 96 FPS. High averages 73 FPS. Ultra drops to 55 FPS, falling 5 FPS short of the 60 FPS playable threshold. The Medium preset's minimum of 71 FPS indicates that even during demanding scenes, the system stays above the playable line. High averages 73 FPS, but no minimum or maximum is recorded for that preset, so variance cannot be assessed from the data.
How This Combo Ranks
Among the 3714 tested CPU-GPU combinations for Lockdown Protocol, this pairing holds rank 1031. That places it in the 72nd percentile of all tested combos — a solid upper-mid-tier position. The rank reflects the combined capability of the Ryzen 5 7400F and RTX 3080, and the measured FPS data supports this positioning: the system clears 60 FPS at every resolution on at least three presets, and at 1440p and 1080p it clears 60 FPS on all four presets.
The ranking suggests that roughly 28% of tested combinations outperform this setup, while the majority fall behind. Given that the RTX 3080 is an end-of-life product (released 2020-08-31) and the Ryzen 5 7400F is a 2025 desktop part, the pairing represents a mix of mature GPU architecture and current CPU architecture. The 1031 rank indicates the GPU is the more limiting factor; newer GPUs with higher percentile scores would likely push this combo higher.
FAQ
Q: Can this system run Lockdown Protocol at 4K Ultra settings above 60 FPS?
A: No. The measured average FPS at 3840x2160 Ultra is 55 FPS, which falls 5 FPS below the 60 FPS playable threshold. The best playable setting at 4K is High, which averages 73 FPS.
Q: What is the best preset at 1440p for maximum visual quality while staying above 60 FPS?
A: Ultra at 2560x1440 averages 85 FPS, which clears the 60 FPS threshold with 25 FPS of headroom. This is the most demanding preset that remains playable at that resolution.
Q: How much performance is lost when moving from 1080p to 4K on the Low preset?
A: The average FPS drops from 249 at 1920x1080 Low to 118 at 3840x2160 Low, a reduction of 131 FPS or roughly 53%. This reflects the GPU becoming the primary bottleneck at higher pixel counts.
Q: Is the Ryzen 5 7400F or the RTX 3080 the limiting factor at 1080p?
A: The data suggests the GPU is the limiting factor even at 1080p. The 53% gap between Low and Ultra at 1080p mirrors the gap at 4K, indicating the GPU's settings scaling is consistent across resolutions and the CPU is not introducing additional constraints.
Q: Does the system maintain its minimum FPS above 60 at 4K Medium?
A: Yes. The minimum recorded FPS at 3840x2160 Medium is 71, which is 11 FPS above the playable threshold. This is the only 4K preset with recorded minimum and maximum values, showing a range of 71 to 96 FPS.
Q: How does this combo compare to other tested systems in the database?
A: It ranks 1031 out of 3714 tested combinations, placing it in the upper 28% of all systems tested for Lockdown Protocol. This is a strong showing for a mid-range desktop CPU paired with a previous-generation high-end GPU.
Best Settings per Resolution
At 1920x1080, the Ultra preset delivers an average of 116 FPS, which is the most demanding setting that remains above 60 FPS. This is the recommended configuration for full visual fidelity at 1080p.
At 2560x1440, Ultra averages 85 FPS, clearing the 60 FPS threshold with room to spare. This is the optimal choice for 1440p, providing maximum quality without sacrificing playability.
At 3840x2160, High is the most demanding preset that stays above 60 FPS, averaging 73 FPS. The Ultra preset falls short at 55 FPS, so High represents the ceiling for 4K playable settings. Low (118 FPS) and Medium (84 FPS) are also viable, but High offers the best balance of visual quality and performance.
The Verdict
This system can run Lockdown Protocol at 60 FPS or above at every tested resolution, but not on every preset. At 1920x1080, all four presets — Low (249 FPS), Medium (177 FPS), High (155 FPS), and Ultra (116 FPS) — clear the playable threshold. At 2560x1440, the same holds true: Low (183 FPS), Medium (130 FPS), High (113 FPS), and Ultra (85 FPS) all exceed 60 FPS. At 3840x2160, three of four presets are playable: Low (118 FPS), Medium (84 FPS), and High (73 FPS). The Ultra preset at 4K averages 55 FPS, which falls below the 60 FPS threshold and is not recommended.
The verdict is clear: this PC is more than capable of running Lockdown Protocol. For 1080p and 1440p users, Ultra settings are playable with substantial headroom. For 4K users, High settings provide a smooth experience at 73 FPS, while Ultra should be avoided due to sub-60 FPS performance. The Ryzen 5 7400F and RTX 3080 pairing ranks in the 72nd percentile of all tested combos, confirming it as a solid upper-mid-tier system for this title.