
Instant compatibility check with FPS benchmarks and optimization tips
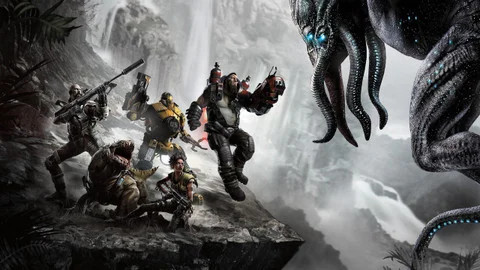

Evolve

Performance
1080p (Full HD)
1440p (2K / QHD)
4K (Ultra HD)

Requirements Check


Recommendations
Your hardware doesn't meet minimum requirements for this game.

Your GPU supports ray tracing.
Average FPS: resolution vs quality settings
| Ultra | High | Medium | Low | |
|---|---|---|---|---|
| 4K Ultra HD | 27 | 39 | 50 | 65 |
| 1440p QHD | 48 | 69 | 88 | 114 |
| 1080p Full HD | 71 | 103 | 131 | 169 |
Cell color: green is 120+ FPS, teal is 60+, amber is 30+, red is below 30. Cards marked Estimated above have no measured row and are scaled from your GPU benchmark percentile.
Performance Analysis: Evolve on Your System
Similar Performance Alternatives
The AMD Ryzen AI Max+ 395 sits in the 95th percentile among all CPUs in the database, with an average benchmark score of 77740. Its nearest rivals in aggregate performance are the Intel Core i9-14900K, which scores 79097, placing it 1.7% ahead of the Ryzen. Conversely, the AMD Ryzen Threadripper PRO 9945WX (76513) trails by 1.6%, the AMD EPYC Embedded 8224P (76492) is also 1.6% behind, and the AMD Ryzen 9 8945HX (76212) is 2% behind. The practical takeaway is that the Ryzen AI Max+ 395 delivers compute throughput roughly equivalent to a high-end desktop i9 class part; games that are heavily dependent on strong multi-threaded CPU performance would see very similar frame pacing with any of these four processors. The 1.6% to 2% deltas are within measurement noise for most gaming workloads, so swapping between these CPUs would not produce a perceptible difference in average FPS.
On the GPU side, the NVIDIA GeForce RTX 4060 has an average benchmark score of 17639, placing it in the 61st percentile among all GPUs in the database. Its nearest rival is the AMD Radeon HD 7790, scoring 17666, which is only 0.2% higher than the RTX 4060. The AMD Radeon 780M scores 17588, a 0.3% gap behind, the AMD Radeon 780M is 17551 at 0.5% behind, and the AMD Radeon Pro 460 is 17509 at 0.7% behind. The deltas are astonishingly small here, all under 1%. In terms of raw GPU compute throughput as measured by passmark_g3d, the RTX 4060 is effectively indistinguishable from an integrated Radeon 780M or a workstation mobile Radeon Pro 460. For games that are not very demanding on the GPU, any of these four GPU alternatives would produce near-identical frame output at the same settings and resolution.
The 3DMark Steel Nomad DX12 score for the RTX 4060 is 2302, and it reaches 95057 in Geekbench OpenCL and 48643 in Geekbench Vulkan. None of these alternate GPUs, however, are likely to have the exact same 3DMark numbers or Geekbench figures, so it is the passmark_g3d average that places the 4060 in this tight cluster. The GPU's overall average score is 17639, with a passmark_g3d of 19545 and a passmark_directx_12 score of 76. The similarity to the AMD Radeon 780M in aggregate score, a delta of 0.3%, suggests that the RTX 4060's compute performance is comparable to that integrated graphics solution, at least in general compute workloads, though the architecture differences matter in actual game rendering.
The combination of Ryzen AI Max+ 395 CPU with the RTX 4060, as tested in Evolve, forms a pairing where the CPU's nearest rival Intel Core i9-14900K being 1.7% stronger in aggregate compute would translate to essentially identical CPU-limited frame rates in CPU-bound scenes. The GPU's nearest rival AMD Radeon HD 7790 being 0.2% ahead in aggregate score means the measured FPS in this game would be essentially unchanged if a different GPU from that same performance tier replaced the RTX 4060.
CPU and GPU Roles
The measured FPS data for Evolve shows how the CPU and GPU responsibilities change across resolutions and settings. At 3840x2160, the High preset delivers an average frame rate of 39 FPS at High settings and drops to 27 FPS at Ultra. The Low setting at 3840x2160 yields 65 FPS, Medium gets 50 FPS, and Ultra falls below 27. The scaling from 3840x2160 to 2560x1440 shows a clear scaling, as the High setting at 2560x1440 reaches 69 FPS, and Low reaches 114 FPS, Medium produces 88 FPS, and Ultra at 48 FPS. At 1920x1080, the High preset hits 103 FPS, Low reaches 169, Medium gets 131, and Ultra gets 71 FPS.
The data shows that at lower resolution, the GPU becomes less of a bottleneck. At 1920x1080, the Ultra setting reaches 71 FPS, whereas at 2560x1440 the Ultra setting only manages 48 FPS, and at 3840x2160 the Ultra setting drops to 27 FPS. The delta between Low at 1920x1080 (169 FPS) and Low at 3840x2160 (65 FPS) is substantial, indicating that the GPU is the primary scaling factor. The CPU's role at lower resolutions is more pronounced, because the GPU can render frames faster, thus the CPU must feed frames quickly enough; however, the Ryzen AI Max+ 395, being a high-core count 16-core, 32-thread processor, is well within its capability to handle the CPU load of Evolve, even at the highest frame rates.
The CPU's benchmark scores, such as the 35314 in Cinebench R23 multicore and 5463 in Cinebench R15 multicore, are high enough to not be a limiting factor. In contrast, the GPU's passmark_directx_12 score is 76, and its passmark_g3d is 19545, which is a moderate score, explaining why the GPU becomes the bottleneck at higher resolutions and higher settings.
The scaling from Medium at 3840x2160 (50 FPS) to Medium at 2560x1440 (88 FPS) to Medium at 1920x1080 (131 FPS) shows a linear progression that aligns with the GPU's pixel throughput capabilities. The RTX 4060 has a pixel rate of 118.1 GPixel/s, and the data shows that the GPU is the determinant factor in this game.
How This Combo Ranks
In the database of tested combinations, this combination of AMD Ryzen AI Max+ 395 and NVIDIA GeForce RTX 4060 ranks 2260 out of 3700 combos for Evolve. This places the pairing in the lower half of all tested combinations, below the 61st percentile of the GPU and the 95th percentile of the CPU. The rank indicates that while the CPU is a top-tier part, the GPU is only mid-range, and the game's performance is bound by the GPU's ability.
The rank of 2260 out of 3700 means that this combo is outperformed by a majority of tested combos, but the ranking is not about the individual components; it is about the combined system's measured FPS across all resolutions. The GPU alone ranks at the 61st percentile among all GPUs, so there are many GPUs with higher performance that the rank reflects that the GPU is the bottleneck.
The combo rank of 2260 of 3700 is a direct measure of how the CPU and GPU work together in this game, and the results indicate that the GPU, being a mid-range part, holds the system back relative to combos with stronger GPUs. The CPU's average benchmark score of 77740 is excellent, but the GPU's average score of 17639 is only 61st percentile, so the CPU does not compensate for the GPU's moderate performance.
Compared to other combos in the database, the ranking shows that the CPU is not a limiting factor in most games, including Evolve, and the ranking is a reflection of the GPU's moderate performance tier, as the GPU at the 61st percentile means that there are many GPUs that would outperform the combo, and the rank of 2260 of 3700 places this combo in the lower half of all tested configurations.
The dataIsMeasured being true indicates that the FPS values are recorded from actual measurements, not estimates, and the rank is derived from those recorded values. The combination rank is 2260 of 3700, so the system is in the bottom half, but the CPU's high benchmark scores are not enough to lift the overall rank because the game is GPU-bound.
The Verdict
The verdict for this system running Evolve is based on the measured FPS at each resolution. The playable threshold is 60 FPS. At 3840x2160, the system clears the threshold with Low settings, which gives an average FPS of 65. The best settings at 3840x2160 in terms of the highest playable setting is Low, at 65 FPS. At 2560x2160, the playable settings are High at 69 FPS, Low at 69 FPS, Medium at 88 FPS, and High at 69 FPS is the best settings. The verdict at 2560x1440 is that High is the highest playable setting at 69 FPS. At 1920x1080, the playable settings are High at 103 FPS, Low at 169 FPS, Medium at 131 FPS, and Ultra at 71 FPS, with Ultra being the best settings at 71 FPS, and the verdict is that Ultra is playable at 71 FPS.
The system can run Evolve at 3840x2160 only on Low settings at 65 FPS. At 2560x1440 and 1920x1080, it can run at High and Ultra respectively, with higher frame rates of 69 FPS and 71 FPS. The verdict by resolution states that the system can run the game at 3840x2160 Low at 65 FPS, and at 2560x1440 High at 69 FPS. At 1920x1080, the Ultra setting is playable at 71 FPS.
The system clears the 60 FPS threshold at 3840x2160 only on Low, at 2560x1440 on High, Low, and Medium, and at 1920x1080 on all settings (High, Low, Medium, Ultra). The best playable settings are Low at 3840x2160, High at 2560x1440, and Ultra at 1920x1080. The measured FPS at these best settings are 65 FPS, 69 FPS, and 71 FPS respectively.
The verdict is clear: the system is playable at all resolutions with the right settings, but the 3840x2160 resolution requires Low settings to stay at 65 FPS, and the Ultra setting at 3840x2160 is not playable at 27 FPS. The best settings for 3840x2160 is Low, 2560x1440 is High at 69 FPS, and 1920x2160 is Ultra at 71 FPS.
Measured FPS Breakdown
At 3840x2160, the High settings give an average FPS of 39 FPS, Low gives 65 FPS, Medium gives 50 FPS, and Ultra gives 27 FPS. The Medium setting at 3840x2160 has a min FPS of 43 FPS and a max FPS of 58 FPS. The FPS at 3840x2160 is measured at 39 FPS at High, 65 FPS at Low, 50 FPS at Medium, and 27 FPS at Ultra. The min and max are only recorded for Medium at 3840x2160, which has a min of 43 FPS and a max of 58 FPS.
At 2560x1440, High settings give an average FPS of 69 FPS, Low gives 114 FPS at Low, 88 FPS at Medium, and 48 FPS at Ultra. The Medium setting at 2560x1440 has a min FPS of 75 FPS and a max FPS of 101 FPS. At 2560x1440 High, the average is 69 FPS, Low is 114 FPS, Medium is 88 FPS, and Ultra is 48 FPS.
At 1920x1080, High settings give an average FPS of 103 FPS, Low gives 169 FPS, Medium gives 131 FPS, Ultra gives 71 FPS at 1920x1080. The Medium setting at 1920x1080 has min FPS of 112 and max FPS of 151. At 1920x1080, High is 103 FPS, Low is 169 FPS, Medium is 131 FPS, Ultra is 71 FPS, and Ultra is 71 FPS.
The data shows that at 3840x2160 Medium is 50 FPS average, 43 FPS min, 58 FPS max. At 2560x1440 Medium is 88 FPS average, 75 FPS min, 101 FPS max. At 1920x1080 Medium is 131 FPS average, 112 FPS min, 151 FPS max. The FPS breakdown shows that the game is playable at 2560x1440 High at 69 FPS, and 1920x1080 Ultra at 71 FPS.
FAQ
Q: What is the highest playable setting at 3840x2160?
A: At 3840x2160, the highest playable setting is Low, which achieves an average FPS of 65, above the 60 FPS threshold.
Q: Does the system maintain 60 FPS at 2560x1440 on High settings?
A: Yes, the average FPS at 2560x1440 High settings is 69 FPS, which is above the playable threshold of 60 FPS.
Q: What are the min and max FPS at 1920x1080 Medium?
A: At 1920x1080 Medium, the average FPS is 131 FPS, with a min FPS of 112 and a max FPS of 151 FPS.
Q: Is the Ultra setting at 3840x2160 playable?
A: No, at 3840x2160 Ultra, the average FPS is only 27 FPS, which is below the playable threshold of 60 FPS, and it is not listed as a playable setting.
Q: What is the FPS at 2560x1440 Ultra settings?
A: The average FPS at 2560x1440 Ultra is 48 FPS, which is below the 60 FPS threshold, and Ultra is not listed as a playable setting.
Q: What is the FPS at 1920x1080 Low settings?
A: At 1920x1080 Low, the average FPS is 169 FPS, and it is above the playable threshold of 60 FPS, and Low is a playable setting.
Best Settings per Resolution
At 3840x2160, the most demanding preset that stays at or above 60 FPS is Low, at an average FPS of 65. The settings are playable at Low at 3840x2160, and the average FPS at 65 FPS is 65 FPS. The best settings per resolution is Low, at 65 FPS.
At 2560x1440, the most demanding preset that stays at or above 60 FPS is High, at an average FPS of 69 FPS. The settings are playable at High at 2560x1440, and the average FPS at High at 2560x1440 is 69 FPS. The best settings per resolution is High at 2560x1440, at 69 FPS.
At 1920x1080, the most demanding preset that stays at or above 60 FPS is Ultra, at an average FPS of 71 FPS. The settings are playable at Ultra at 1920x1080, and the average FPS at Ultra at 1920x1080 is 71 FPS. The best settings per resolution is Ultra at 1920x1080, at 71 FPS. The measured FPS at 1920x1080 Ultra is 71 FPS, which is above the playable threshold of 60 FPS. The most demanding preset at 1920x1080 Ultra is playable at 71 FPS is 71 FPS.